
Advertisement
- United States
- /
- Professional Services
- /
- NYSE:BAH
Estimating The Intrinsic Value Of Booz Allen Hamilton Holding Corporation (NYSE:BAH)
Key Insights
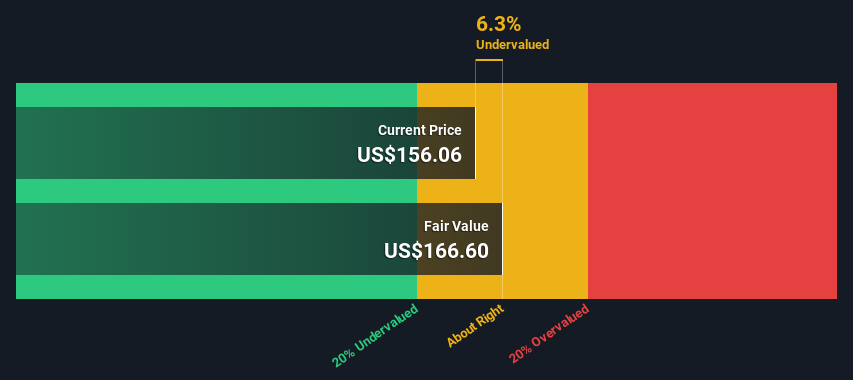
- The projected fair value for Booz Allen Hamilton Holding is US$167 based on 2 Stage Free Cash Flow to Equity
- With US$156 share price, Booz Allen Hamilton Holding appears to be trading close to its estimated fair value
- Our fair value estimate is 8.0% higher than Booz Allen Hamilton Holding's analyst price target of US$154
Today we'll do a simple run through of a valuation method used to estimate the attractiveness of Booz Allen Hamilton Holding Corporation (NYSE:BAH) as an investment opportunity by estimating the company's future cash flows and discounting them to their present value. We will take advantage of the Discounted Cash Flow (DCF) model for this purpose. There's really not all that much to it, even though it might appear quite complex.
Companies can be valued in a lot of ways, so we would point out that a DCF is not perfect for every situation. If you want to learn more about discounted cash flow, the rationale behind this calculation can be read in detail in the Simply Wall St analysis model.
View our latest analysis for Booz Allen Hamilton Holding
The Method
We're using the 2-stage growth model, which simply means we take in account two stages of company's growth. In the initial period the company may have a higher growth rate and the second stage is usually assumed to have a stable growth rate. In the first stage we need to estimate the cash flows to the business over the next ten years. Where possible we use analyst estimates, but when these aren't available we extrapolate the previous free cash flow (FCF) from the last estimate or reported value. We assume companies with shrinking free cash flow will slow their rate of shrinkage, and that companies with growing free cash flow will see their growth rate slow, over this period. We do this to reflect that growth tends to slow more in the early years than it does in later years.
Generally we assume that a dollar today is more valuable than a dollar in the future, and so the sum of these future cash flows is then discounted to today's value:
10-year free cash flow (FCF) forecast
| 2024 | 2025 | 2026 | 2027 | 2028 | 2029 | 2030 | 2031 | 2032 | 2033 | |
| Levered FCF ($, Millions) | US$179.4m | US$751.0m | US$853.4m | US$929.7m | US$994.5m | US$1.05b | US$1.10b | US$1.14b | US$1.18b | US$1.22b |
| Growth Rate Estimate Source | Analyst x6 | Analyst x7 | Analyst x5 | Est @ 8.94% | Est @ 6.97% | Est @ 5.59% | Est @ 4.63% | Est @ 3.96% | Est @ 3.48% | Est @ 3.15% |
| Present Value ($, Millions) Discounted @ 6.7% | US$168 | US$660 | US$703 | US$718 | US$720 | US$713 | US$699 | US$681 | US$661 | US$639 |
("Est" = FCF growth rate estimated by Simply Wall St)
Present Value of 10-year Cash Flow (PVCF) = US$6.4b
The second stage is also known as Terminal Value, this is the business's cash flow after the first stage. For a number of reasons a very conservative growth rate is used that cannot exceed that of a country's GDP growth. In this case we have used the 5-year average of the 10-year government bond yield (2.4%) to estimate future growth. In the same way as with the 10-year 'growth' period, we discount future cash flows to today's value, using a cost of equity of 6.7%.
Terminal Value (TV)= FCF2033 × (1 + g) ÷ (r – g) = US$1.2b× (1 + 2.4%) ÷ (6.7%– 2.4%) = US$29b
Present Value of Terminal Value (PVTV)= TV / (1 + r)10= US$29b÷ ( 1 + 6.7%)10= US$15b
The total value, or equity value, is then the sum of the present value of the future cash flows, which in this case is US$22b. To get the intrinsic value per share, we divide this by the total number of shares outstanding. Compared to the current share price of US$156, the company appears about fair value at a 6.3% discount to where the stock price trades currently. Valuations are imprecise instruments though, rather like a telescope - move a few degrees and end up in a different galaxy. Do keep this in mind.
Important Assumptions
The calculation above is very dependent on two assumptions. The first is the discount rate and the other is the cash flows. Part of investing is coming up with your own evaluation of a company's future performance, so try the calculation yourself and check your own assumptions. The DCF also does not consider the possible cyclicality of an industry, or a company's future capital requirements, so it does not give a full picture of a company's potential performance. Given that we are looking at Booz Allen Hamilton Holding as potential shareholders, the cost of equity is used as the discount rate, rather than the cost of capital (or weighted average cost of capital, WACC) which accounts for debt. In this calculation we've used 6.7%, which is based on a levered beta of 0.933. Beta is a measure of a stock's volatility, compared to the market as a whole. We get our beta from the industry average beta of globally comparable companies, with an imposed limit between 0.8 and 2.0, which is a reasonable range for a stable business.
SWOT Analysis for Booz Allen Hamilton Holding
Strength
- Debt is well covered by earnings.
Weakness
- Earnings declined over the past year.
- Dividend is low compared to the top 25% of dividend payers in the Professional Services market.
Opportunity
- Annual earnings are forecast to grow faster than the American market.
- Current share price is below our estimate of fair value.
Threat
- Debt is not well covered by operating cash flow.
- Dividends are not covered by cash flow.
- Annual revenue is forecast to grow slower than the American market.
Next Steps:
Although the valuation of a company is important, it ideally won't be the sole piece of analysis you scrutinize for a company. The DCF model is not a perfect stock valuation tool. Preferably you'd apply different cases and assumptions and see how they would impact the company's valuation. For example, changes in the company's cost of equity or the risk free rate can significantly impact the valuation. For Booz Allen Hamilton Holding, we've put together three fundamental items you should assess:
- Risks: For example, we've discovered 2 warning signs for Booz Allen Hamilton Holding (1 doesn't sit too well with us!) that you should be aware of before investing here.
- Future Earnings: How does BAH's growth rate compare to its peers and the wider market? Dig deeper into the analyst consensus number for the upcoming years by interacting with our free analyst growth expectation chart.
- Other High Quality Alternatives: Do you like a good all-rounder? Explore our interactive list of high quality stocks to get an idea of what else is out there you may be missing!
PS. Simply Wall St updates its DCF calculation for every American stock every day, so if you want to find the intrinsic value of any other stock just search here.
Valuation is complex, but we're here to simplify it.
Discover if Booz Allen Hamilton Holding might be undervalued or overvalued with our detailed analysis, featuring fair value estimates, potential risks, dividends, insider trades, and its financial condition.
Access Free AnalysisHave feedback on this article? Concerned about the content? Get in touch with us directly. Alternatively, email editorial-team (at) simplywallst.com.
This article by Simply Wall St is general in nature. We provide commentary based on historical data and analyst forecasts only using an unbiased methodology and our articles are not intended to be financial advice. It does not constitute a recommendation to buy or sell any stock, and does not take account of your objectives, or your financial situation. We aim to bring you long-term focused analysis driven by fundamental data. Note that our analysis may not factor in the latest price-sensitive company announcements or qualitative material. Simply Wall St has no position in any stocks mentioned.
About NYSE:BAH
Booz Allen Hamilton Holding
A technology company, provides technology solutions using artificial intelligence, cyber, and other technologies for government’s cabinet-level departments and commercial customers in the United States and internationally.
Undervalued with solid track record.
Similar Companies
Market Insights

Advertisement
Community Narratives
100% Patient Improvement in trial puts this $16M Biotech on the radar
Fair Value US$5.30|65.7% undervalued
JO
Community Contributor
Exxon Mobil's 17.5% Upside Promises Industry-Leading Returns in Energy Transition
Fair Value US$132.00|14.9% undervalued
HE
Community Contributor
NHC Analysis: Quality at a Good Price. A Golden Opportunity?
Fair Value US$179.80|35.4% undervalued
DA
Community Contributor
Product Refresh And Global Expansion Will Empower Future Market Leadership
Fair Value US$202.60|21.0% undervalued
AN
Based on Analyst Price Targets