- United States
- /
- Commercial Services
- /
- NasdaqGS:TILE
Interface (NASDAQ:TILE) Has A Somewhat Strained Balance Sheet


David Iben put it well when he said, 'Volatility is not a risk we care about. What we care about is avoiding the permanent loss of capital.' So it might be obvious that you need to consider debt, when you think about how risky any given stock is, because too much debt can sink a company. Importantly, Interface, Inc. (NASDAQ:TILE) does carry debt. But is this debt a concern to shareholders?
When Is Debt Dangerous?
Debt assists a business until the business has trouble paying it off, either with new capital or with free cash flow. In the worst case scenario, a company can go bankrupt if it cannot pay its creditors. However, a more common (but still painful) scenario is that it has to raise new equity capital at a low price, thus permanently diluting shareholders. Of course, plenty of companies use debt to fund growth, without any negative consequences. When we think about a company's use of debt, we first look at cash and debt together.
Check out our latest analysis for Interface
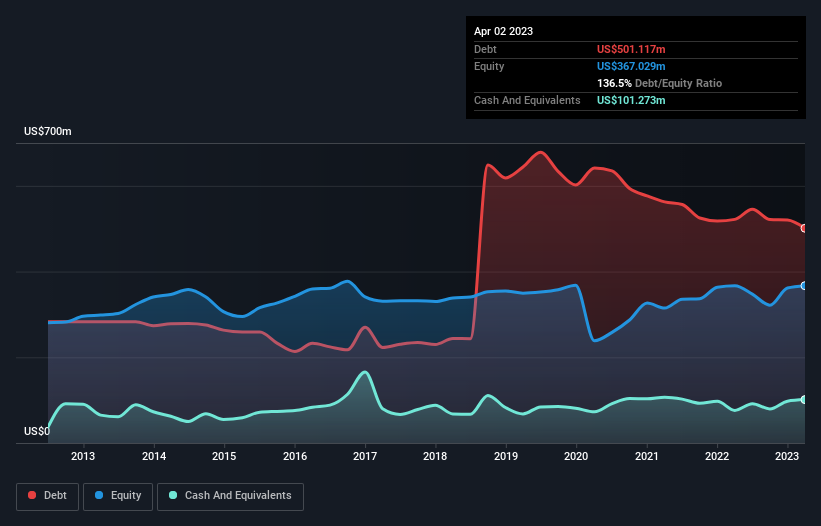
What Is Interface's Debt?
As you can see below, Interface had US$501.1m of debt, at April 2023, which is about the same as the year before. You can click the chart for greater detail. However, because it has a cash reserve of US$101.3m, its net debt is less, at about US$399.8m.
How Healthy Is Interface's Balance Sheet?
The latest balance sheet data shows that Interface had liabilities of US$221.5m due within a year, and liabilities of US$664.7m falling due after that. Offsetting these obligations, it had cash of US$101.3m as well as receivables valued at US$147.8m due within 12 months. So its liabilities total US$637.1m more than the combination of its cash and short-term receivables.
When you consider that this deficiency exceeds the company's US$447.6m market capitalization, you might well be inclined to review the balance sheet intently. In the scenario where the company had to clean up its balance sheet quickly, it seems likely shareholders would suffer extensive dilution.
We use two main ratios to inform us about debt levels relative to earnings. The first is net debt divided by earnings before interest, tax, depreciation, and amortization (EBITDA), while the second is how many times its earnings before interest and tax (EBIT) covers its interest expense (or its interest cover, for short). This way, we consider both the absolute quantum of the debt, as well as the interest rates paid on it.
Interface's debt is 2.8 times its EBITDA, and its EBIT cover its interest expense 3.2 times over. This suggests that while the debt levels are significant, we'd stop short of calling them problematic. Investors should also be troubled by the fact that Interface saw its EBIT drop by 19% over the last twelve months. If things keep going like that, handling the debt will about as easy as bundling an angry house cat into its travel box. The balance sheet is clearly the area to focus on when you are analysing debt. But it is future earnings, more than anything, that will determine Interface's ability to maintain a healthy balance sheet going forward. So if you want to see what the professionals think, you might find this free report on analyst profit forecasts to be interesting.
But our final consideration is also important, because a company cannot pay debt with paper profits; it needs cold hard cash. So we always check how much of that EBIT is translated into free cash flow. During the last three years, Interface produced sturdy free cash flow equating to 65% of its EBIT, about what we'd expect. This free cash flow puts the company in a good position to pay down debt, when appropriate.
Our View
To be frank both Interface's level of total liabilities and its track record of (not) growing its EBIT make us rather uncomfortable with its debt levels. But at least it's pretty decent at converting EBIT to free cash flow; that's encouraging. Overall, it seems to us that Interface's balance sheet is really quite a risk to the business. For this reason we're pretty cautious about the stock, and we think shareholders should keep a close eye on its liquidity. The balance sheet is clearly the area to focus on when you are analysing debt. But ultimately, every company can contain risks that exist outside of the balance sheet. To that end, you should learn about the 3 warning signs we've spotted with Interface (including 1 which is concerning) .
If, after all that, you're more interested in a fast growing company with a rock-solid balance sheet, then check out our list of net cash growth stocks without delay.
New: AI Stock Screener & Alerts
Our new AI Stock Screener scans the market every day to uncover opportunities.
• Dividend Powerhouses (3%+ Yield)
• Undervalued Small Caps with Insider Buying
• High growth Tech and AI Companies
Or build your own from over 50 metrics.
Have feedback on this article? Concerned about the content? Get in touch with us directly. Alternatively, email editorial-team (at) simplywallst.com.
This article by Simply Wall St is general in nature. We provide commentary based on historical data and analyst forecasts only using an unbiased methodology and our articles are not intended to be financial advice. It does not constitute a recommendation to buy or sell any stock, and does not take account of your objectives, or your financial situation. We aim to bring you long-term focused analysis driven by fundamental data. Note that our analysis may not factor in the latest price-sensitive company announcements or qualitative material. Simply Wall St has no position in any stocks mentioned.
About NasdaqGS:TILE
Interface
Designs, produces, and sells modular carpet products in the United States, Canada, Latin America, Europe, Africa, Asia, and Australia.
Very undervalued with flawless balance sheet.
Similar Companies
Market Insights

Community Narratives

