
Advertisement
- United States
- /
- Professional Services
- /
- NasdaqGS:NVEE
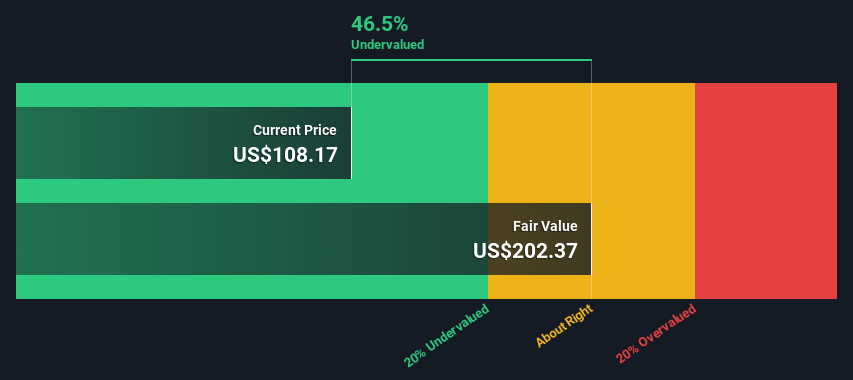
Are Investors Undervaluing NV5 Global, Inc. (NASDAQ:NVEE) By 47%?

Key Insights
- NV5 Global's estimated fair value is US$202 based on 2 Stage Free Cash Flow to Equity
- NV5 Global is estimated to be 47% undervalued based on current share price of US$108
- The US$125 analyst price target for NVEE is 38% less than our estimate of fair value
Today we'll do a simple run through of a valuation method used to estimate the attractiveness of NV5 Global, Inc. (NASDAQ:NVEE) as an investment opportunity by taking the forecast future cash flows of the company and discounting them back to today's value. One way to achieve this is by employing the Discounted Cash Flow (DCF) model. Don't get put off by the jargon, the math behind it is actually quite straightforward.
Companies can be valued in a lot of ways, so we would point out that a DCF is not perfect for every situation. If you want to learn more about discounted cash flow, the rationale behind this calculation can be read in detail in the Simply Wall St analysis model.
View our latest analysis for NV5 Global
Crunching The Numbers
We are going to use a two-stage DCF model, which, as the name states, takes into account two stages of growth. The first stage is generally a higher growth period which levels off heading towards the terminal value, captured in the second 'steady growth' period. To start off with, we need to estimate the next ten years of cash flows. Where possible we use analyst estimates, but when these aren't available we extrapolate the previous free cash flow (FCF) from the last estimate or reported value. We assume companies with shrinking free cash flow will slow their rate of shrinkage, and that companies with growing free cash flow will see their growth rate slow, over this period. We do this to reflect that growth tends to slow more in the early years than it does in later years.
Generally we assume that a dollar today is more valuable than a dollar in the future, so we need to discount the sum of these future cash flows to arrive at a present value estimate:
10-year free cash flow (FCF) estimate
| 2024 | 2025 | 2026 | 2027 | 2028 | 2029 | 2030 | 2031 | 2032 | 2033 | |
| Levered FCF ($, Millions) | US$102.7m | US$122.2m | US$136.6m | US$148.8m | US$159.1m | US$167.9m | US$175.5m | US$182.2m | US$188.3m | US$194.0m |
| Growth Rate Estimate Source | Analyst x5 | Analyst x4 | Est @ 11.82% | Est @ 8.94% | Est @ 6.92% | Est @ 5.51% | Est @ 4.52% | Est @ 3.83% | Est @ 3.35% | Est @ 3.01% |
| Present Value ($, Millions) Discounted @ 6.9% | US$96.0 | US$107 | US$112 | US$114 | US$114 | US$112 | US$110 | US$106 | US$103 | US$99.1 |
("Est" = FCF growth rate estimated by Simply Wall St)
Present Value of 10-year Cash Flow (PVCF) = US$1.1b
After calculating the present value of future cash flows in the initial 10-year period, we need to calculate the Terminal Value, which accounts for all future cash flows beyond the first stage. For a number of reasons a very conservative growth rate is used that cannot exceed that of a country's GDP growth. In this case we have used the 5-year average of the 10-year government bond yield (2.2%) to estimate future growth. In the same way as with the 10-year 'growth' period, we discount future cash flows to today's value, using a cost of equity of 6.9%.
Terminal Value (TV)= FCF2033 × (1 + g) ÷ (r – g) = US$194m× (1 + 2.2%) ÷ (6.9%– 2.2%) = US$4.2b
Present Value of Terminal Value (PVTV)= TV / (1 + r)10= US$4.2b÷ ( 1 + 6.9%)10= US$2.1b
The total value, or equity value, is then the sum of the present value of the future cash flows, which in this case is US$3.2b. To get the intrinsic value per share, we divide this by the total number of shares outstanding. Relative to the current share price of US$108, the company appears quite good value at a 47% discount to where the stock price trades currently. Valuations are imprecise instruments though, rather like a telescope - move a few degrees and end up in a different galaxy. Do keep this in mind.
Important Assumptions
Now the most important inputs to a discounted cash flow are the discount rate, and of course, the actual cash flows. You don't have to agree with these inputs, I recommend redoing the calculations yourself and playing with them. The DCF also does not consider the possible cyclicality of an industry, or a company's future capital requirements, so it does not give a full picture of a company's potential performance. Given that we are looking at NV5 Global as potential shareholders, the cost of equity is used as the discount rate, rather than the cost of capital (or weighted average cost of capital, WACC) which accounts for debt. In this calculation we've used 6.9%, which is based on a levered beta of 0.945. Beta is a measure of a stock's volatility, compared to the market as a whole. We get our beta from the industry average beta of globally comparable companies, with an imposed limit between 0.8 and 2.0, which is a reasonable range for a stable business.
SWOT Analysis for NV5 Global
Strength
- Debt is not viewed as a risk.
Weakness
- Earnings declined over the past year.
- Shareholders have been diluted in the past year.
Opportunity
- Annual earnings are forecast to grow faster than the American market.
- Trading below our estimate of fair value by more than 20%.
Threat
- Annual revenue is forecast to grow slower than the American market.
Next Steps:
Whilst important, the DCF calculation shouldn't be the only metric you look at when researching a company. It's not possible to obtain a foolproof valuation with a DCF model. Preferably you'd apply different cases and assumptions and see how they would impact the company's valuation. If a company grows at a different rate, or if its cost of equity or risk free rate changes sharply, the output can look very different. Can we work out why the company is trading at a discount to intrinsic value? For NV5 Global, there are three essential aspects you should explore:
- Risks: For example, we've discovered 3 warning signs for NV5 Global that you should be aware of before investing here.
- Future Earnings: How does NVEE's growth rate compare to its peers and the wider market? Dig deeper into the analyst consensus number for the upcoming years by interacting with our free analyst growth expectation chart.
- Other High Quality Alternatives: Do you like a good all-rounder? Explore our interactive list of high quality stocks to get an idea of what else is out there you may be missing!
PS. Simply Wall St updates its DCF calculation for every American stock every day, so if you want to find the intrinsic value of any other stock just search here.
Valuation is complex, but we're here to simplify it.
Discover if NV5 Global might be undervalued or overvalued with our detailed analysis, featuring fair value estimates, potential risks, dividends, insider trades, and its financial condition.
Access Free AnalysisHave feedback on this article? Concerned about the content? Get in touch with us directly. Alternatively, email editorial-team (at) simplywallst.com.
This article by Simply Wall St is general in nature. We provide commentary based on historical data and analyst forecasts only using an unbiased methodology and our articles are not intended to be financial advice. It does not constitute a recommendation to buy or sell any stock, and does not take account of your objectives, or your financial situation. We aim to bring you long-term focused analysis driven by fundamental data. Note that our analysis may not factor in the latest price-sensitive company announcements or qualitative material. Simply Wall St has no position in any stocks mentioned.
About NasdaqGS:NVEE
NV5 Global
Provides technology, conformity assessment, consulting solutions, and software applications in the United States and internationally.
Flawless balance sheet with moderate growth potential.
Similar Companies
Market Insights

Advertisement
Community Narratives
WhiteCap Is Positioned To Profit Regardless Of Trump's Policy 
Fair Value CA$22.60|61.6% undervalued
ST
Equity Analyst and Writer
Microsoft's Evolution Will Drive Revenue to New Heights Fueled by AI
Fair Value US$360.00|29.9% overvalued
BR
Community Contributor
A CASE FOR USD$2.50 (CAD$3.44) BY 2028 (A 5-10 BAGGER)
Fair Value CA$3.44|87.8% undervalued
AG
Community Contributor