
Advertisement
- United States
- /
- Professional Services
- /
- NasdaqGM:INOD
Innodata (NASDAQ:INOD) Is In A Good Position To Deliver On Growth Plans
There's no doubt that money can be made by owning shares of unprofitable businesses. For example, although software-as-a-service business Salesforce.com lost money for years while it grew recurring revenue, if you held shares since 2005, you'd have done very well indeed. Nonetheless, only a fool would ignore the risk that a loss making company burns through its cash too quickly.
So should Innodata (NASDAQ:INOD) shareholders be worried about its cash burn? In this article, we define cash burn as its annual (negative) free cash flow, which is the amount of money a company spends each year to fund its growth. The first step is to compare its cash burn with its cash reserves, to give us its 'cash runway'.
Check out our latest analysis for Innodata
How Long Is Innodata's Cash Runway?
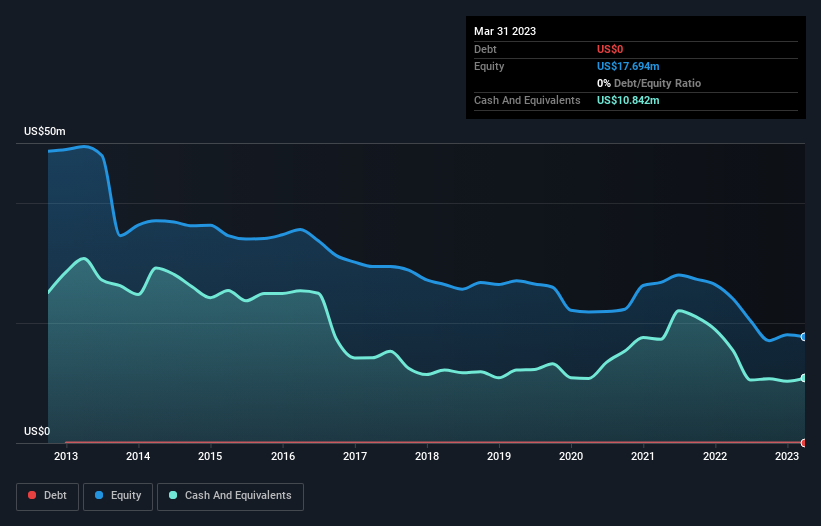
A cash runway is defined as the length of time it would take a company to run out of money if it kept spending at its current rate of cash burn. In March 2023, Innodata had US$11m in cash, and was debt-free. In the last year, its cash burn was US$4.2m. That means it had a cash runway of about 2.6 years as of March 2023. Arguably, that's a prudent and sensible length of runway to have. The image below shows how its cash balance has been changing over the last few years.
How Well Is Innodata Growing?
At first glance it's a bit worrying to see that Innodata actually boosted its cash burn by 45%, year on year. The revenue growth of 2.2% gives a ray of hope, at the very least. Considering both these factors, we're not particularly excited by its growth profile. Of course, we've only taken a quick look at the stock's growth metrics, here. This graph of historic earnings and revenue shows how Innodata is building its business over time.
Can Innodata Raise More Cash Easily?
Innodata seems to be in a fairly good position, in terms of cash burn, but we still think it's worthwhile considering how easily it could raise more money if it wanted to. Companies can raise capital through either debt or equity. One of the main advantages held by publicly listed companies is that they can sell shares to investors to raise cash and fund growth. By looking at a company's cash burn relative to its market capitalisation, we gain insight on how much shareholders would be diluted if the company needed to raise enough cash to cover another year's cash burn.
Since it has a market capitalisation of US$307m, Innodata's US$4.2m in cash burn equates to about 1.4% of its market value. So it could almost certainly just borrow a little to fund another year's growth, or else easily raise the cash by issuing a few shares.
So, Should We Worry About Innodata's Cash Burn?
As you can probably tell by now, we're not too worried about Innodata's cash burn. For example, we think its cash burn relative to its market cap suggests that the company is on a good path. Although its increasing cash burn does give us reason for pause, the other metrics we discussed in this article form a positive picture overall. Considering all the factors discussed in this article, we're not overly concerned about the company's cash burn, although we do think shareholders should keep an eye on how it develops. On another note, we conducted an in-depth investigation of the company, and identified 3 warning signs for Innodata (2 shouldn't be ignored!) that you should be aware of before investing here.
Of course, you might find a fantastic investment by looking elsewhere. So take a peek at this free list of companies insiders are buying, and this list of stocks growth stocks (according to analyst forecasts)
New: AI Stock Screener & Alerts
Our new AI Stock Screener scans the market every day to uncover opportunities.
• Dividend Powerhouses (3%+ Yield)
• Undervalued Small Caps with Insider Buying
• High growth Tech and AI Companies
Or build your own from over 50 metrics.
Have feedback on this article? Concerned about the content? Get in touch with us directly. Alternatively, email editorial-team (at) simplywallst.com.
This article by Simply Wall St is general in nature. We provide commentary based on historical data and analyst forecasts only using an unbiased methodology and our articles are not intended to be financial advice. It does not constitute a recommendation to buy or sell any stock, and does not take account of your objectives, or your financial situation. We aim to bring you long-term focused analysis driven by fundamental data. Note that our analysis may not factor in the latest price-sensitive company announcements or qualitative material. Simply Wall St has no position in any stocks mentioned.
About NasdaqGM:INOD
Innodata
Operates as a data engineering company in the United States, the United Kingdom, the Netherlands, Canada, and internationally.
Flawless balance sheet with solid track record.
Similar Companies
Market Insights

Advertisement
Community Narratives
The company that turned a verb into a global necessity and basically runs the modern internet, digital ads, smartphones, maps, and AI.
Fair Value US$300.00|6.2% undervalued
OS
Community Contributor
Flowers Foods Pays A Fair Price For Health
Fair Value US$16.12|25.1% undervalued
NV
Community Contributor
TMX Group will thrive with 33.3% profit margin and enduring market moat
Fair Value CA$49.90|0.04% overvalued
LI
Community Contributor