Advertisement
- United States
- /
- Commercial Services
- /
- NasdaqGS:CECO
Can CECO Environmental Sustain Momentum After 58% Rally and Strong Q1 2025 Results?

Simply Wall St
Reviewed by Bailey Pemberton
Are you trying to decide what to do with CECO Environmental stock right now? You are not alone. After all, it is not every day you see a company with this kind of momentum. Shares have soared an eye-popping 533.8% over the last five years and are up 58.6% just since January. If you have been following the clean technology space, you will have noticed a rising interest in companies that help industry meet stricter environmental standards. CECO Environmental, with its focus on air quality and fluid handling solutions, is riding that trend in a big way. The last month brought a 5.7% gain, though the past week was a mild dip of -0.9%, perhaps reflecting broader market jitters or just some healthy profit-taking after a notable runup.
But with a track record like that, many investors are starting to worry about valuation. Has all the good news already been priced in, or is there untapped potential left in CECO stock? Based on a value scoring system, where companies earn 1 point for each undervalued metric out of six, CECO Environmental clocks in at 3. That is firmly in the “potential bargain” territory, but not a slam dunk. So how should we actually think about an investment at these levels, and which valuation approaches make the most sense as we look forward? Let’s break down the numbers with a critical eye. At the end, I will share the best way I have found to really capture CECO’s value story.
Approach 1: CECO Environmental Discounted Cash Flow (DCF) Analysis
A Discounted Cash Flow (DCF) model estimates a company's true value by projecting its future cash flows and discounting them back to today's dollars. This approach aims to capture the intrinsic worth of CECO Environmental based on its ability to generate free cash over time.
Currently, CECO Environmental has a free cash flow of about -$14.9 Million. That negative figure reflects recent investments or operational headwinds, but analysts project a substantial turnaround. Looking ahead, consensus estimates forecast free cash flow to reach $86.7 Million by 2027. Simply Wall St extends these projections further, showing steady increases through 2035. Annual growth rates are expected to moderate over time as the company matures.
Using these forecasts, the DCF model calculates an intrinsic value of $80.45 per share. Because this is 38.1% higher than the current share price, it implies the stock is notably undervalued according to projected cash generation potential.
Result: UNDERVALUED
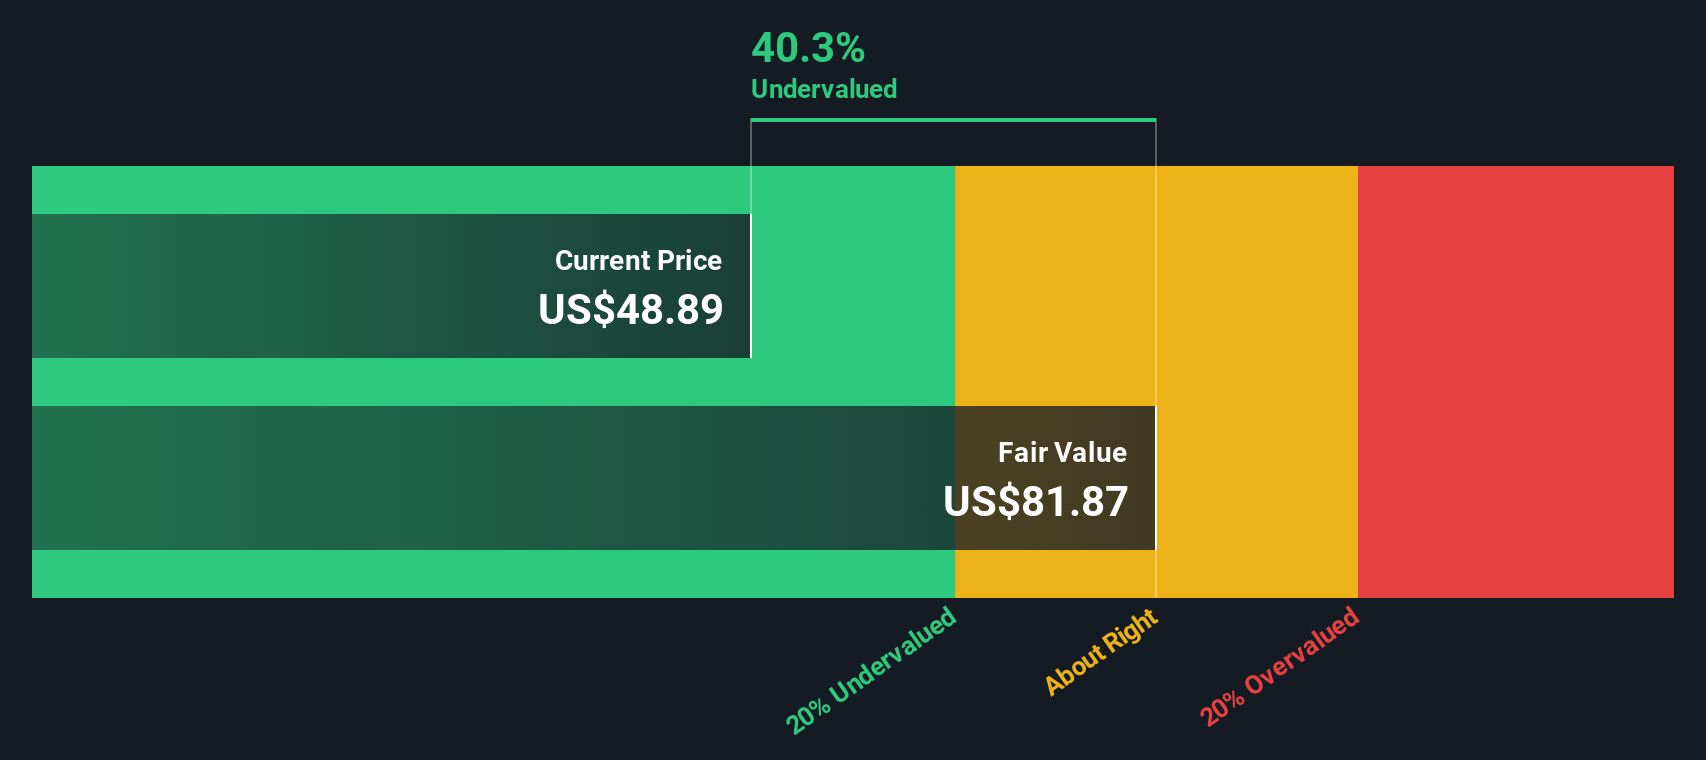
Our Discounted Cash Flow (DCF) analysis suggests CECO Environmental is undervalued by 38.1%. Track this in your watchlist or portfolio, or discover more undervalued stocks.
Approach 2: CECO Environmental Price vs Earnings (PE Ratio)
The price-to-earnings (PE) ratio is a widely used metric for valuing profitable companies because it ties a business’s market value directly to its current earnings power. For firms like CECO Environmental that have positive earnings, the PE ratio helps investors see how much they are paying for each dollar of profit, making it especially relevant for assessing value in mature and growth-stage companies alike.
Determining what counts as a "normal" or "fair" PE ratio, however, is nuanced. It is shaped not only by current profit levels, but also by expectations for future earnings growth and the perceived risks in the business model. Higher growth companies typically command higher PE ratios, while those facing headwinds or uncertainties warrant lower ones.
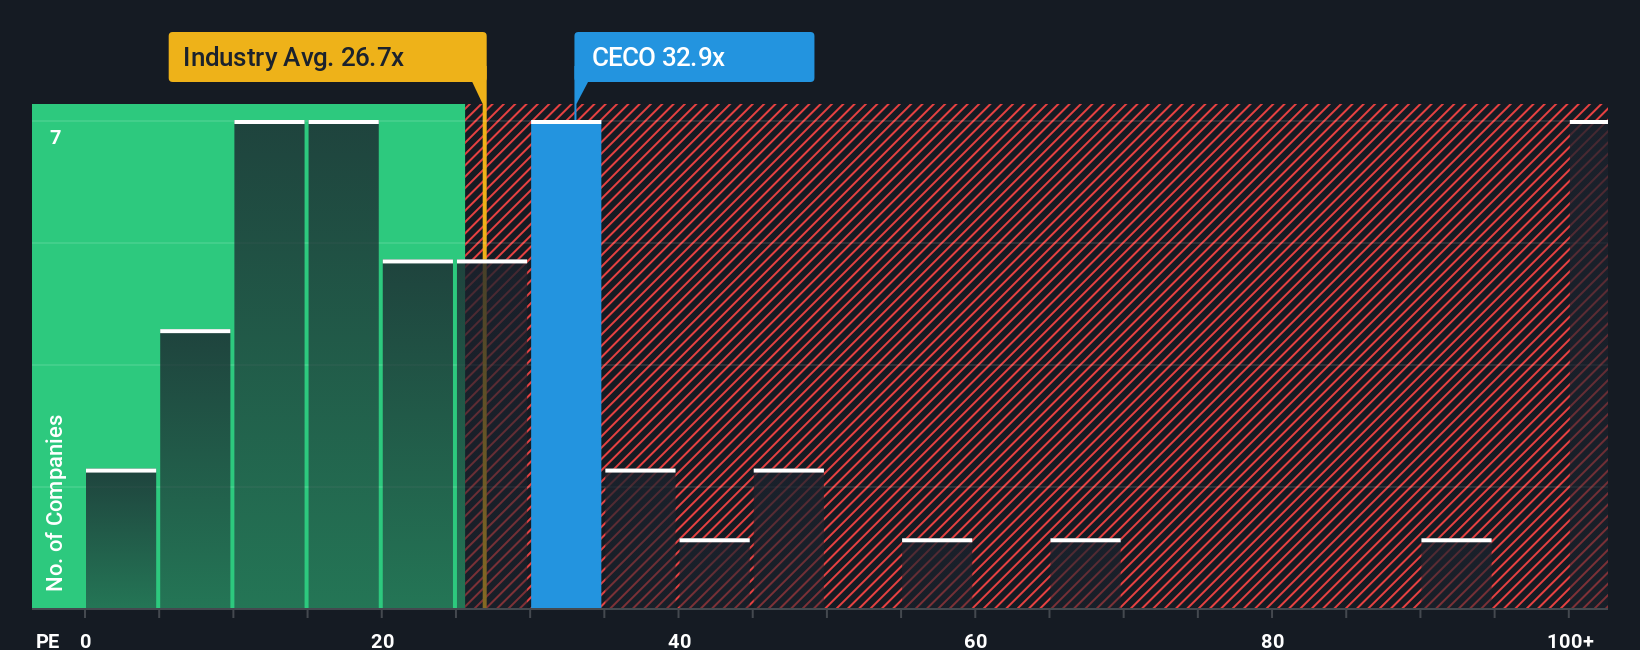
CECO Environmental’s current PE ratio stands at 33.55x. Compared to both the Commercial Services industry average of 27.19x and the average of its peers at 50.57x, CECO trades at a moderate premium to its broader industry, but a substantial discount to direct peers. To provide an even more tailored benchmark, Simply Wall St’s proprietary Fair Ratio comes in at 18.04x. This Fair Ratio incorporates not only industry and peer multiples but also factors in CECO’s unique growth profile, margins, risk, and market size, offering a more nuanced and company-specific view of what is considered fair value.
Since CECO’s actual PE is significantly above its Fair Ratio, this suggests the stock is trading at a premium to what its fundamentals justify, even after accounting for its growth and sector characteristics.
Result: OVERVALUED
PE ratios tell one story, but what if the real opportunity lies elsewhere? Discover companies where insiders are betting big on explosive growth.
Upgrade Your Decision Making: Choose your CECO Environmental Narrative
Earlier we mentioned that there is an even better way to understand valuation, so let's introduce you to Narratives. A Narrative is a simple, interactive way to define your own story behind CECO Environmental's numbers, capturing your unique perspective on its future growth, earnings, margins, and risks, and then instantly seeing what that means for fair value.
Narratives connect what is happening in the real world, such as CECO’s international expansion, margin trends, and pipeline wins, to a set of financial forecasts and ultimately a fair value. Available right now on Simply Wall St’s Community page, Narratives are used by millions of investors as a practical tool to compare their outlook to the market’s, helping decide when to buy or sell by weighing their calculated Fair Value against the current Price.
The best part is Narratives update dynamically whenever new information arrives, so your valuation is always informed by the latest news, earnings, and company developments. For example, one investor might assume international growth stays strong and rate CECO’s fair value at $56.0 per share, while another, focused on rising costs and execution risks, may conclude the value is closer to $46.0. The Narrative framework makes it clear and actionable to see where you stand.
Do you think there's more to the story for CECO Environmental? Create your own Narrative to let the Community know!
This article by Simply Wall St is general in nature. We provide commentary based on historical data and analyst forecasts only using an unbiased methodology and our articles are not intended to be financial advice. It does not constitute a recommendation to buy or sell any stock, and does not take account of your objectives, or your financial situation. We aim to bring you long-term focused analysis driven by fundamental data. Note that our analysis may not factor in the latest price-sensitive company announcements or qualitative material. Simply Wall St has no position in any stocks mentioned.
New: AI Stock Screener & Alerts
Our new AI Stock Screener scans the market every day to uncover opportunities.
• Dividend Powerhouses (3%+ Yield)
• Undervalued Small Caps with Insider Buying
• High growth Tech and AI Companies
Or build your own from over 50 metrics.
Have feedback on this article? Concerned about the content? Get in touch with us directly. Alternatively, email editorial-team@simplywallst.com
About NasdaqGS:CECO
CECO Environmental
Provides critical solutions in industrial air quality, industrial water treatment, and energy transition solutions in the United States, the United Kingdom, the Netherlands, China, and internationally.
Proven track record with slight risk.
Market Insights

Advertisement
Community Narratives
Kodiak AI - a potential 100 bagger opportunity?
Fair Value US$14.00|44.7% undervalued
DA
Community Contributor
A Fair Price for a Great Business Facing Real Threats
Fair Value US$383.06|13.0% undervalued
IM
Community Contributor
AXON And Shopify Integration Will Unlock Global Mobile Advertising
Fair Value US$646.30|0% overvalued
AN
Based on Analyst Price Targets