- United States
- /
- Commercial Services
- /
- NasdaqGS:ACVA
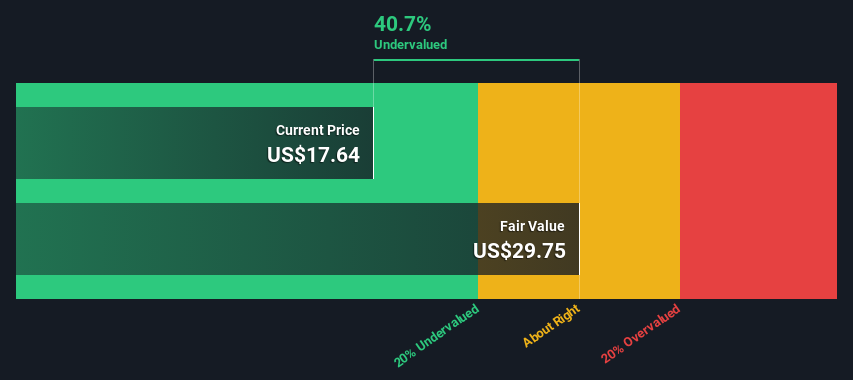
Are Investors Undervaluing ACV Auctions Inc. (NASDAQ:ACVA) By 41%?


Key Insights
- ACV Auctions' estimated fair value is US$29.75 based on 2 Stage Free Cash Flow to Equity
- ACV Auctions' US$17.64 share price signals that it might be 41% undervalued
- The US$20.15 analyst price target for ACVA is 32% less than our estimate of fair value
Today we will run through one way of estimating the intrinsic value of ACV Auctions Inc. (NASDAQ:ACVA) by projecting its future cash flows and then discounting them to today's value. This will be done using the Discounted Cash Flow (DCF) model. It may sound complicated, but actually it is quite simple!
We generally believe that a company's value is the present value of all of the cash it will generate in the future. However, a DCF is just one valuation metric among many, and it is not without flaws. If you still have some burning questions about this type of valuation, take a look at the Simply Wall St analysis model.
View our latest analysis for ACV Auctions
The Method
We use what is known as a 2-stage model, which simply means we have two different periods of growth rates for the company's cash flows. Generally the first stage is higher growth, and the second stage is a lower growth phase. To start off with, we need to estimate the next ten years of cash flows. Where possible we use analyst estimates, but when these aren't available we extrapolate the previous free cash flow (FCF) from the last estimate or reported value. We assume companies with shrinking free cash flow will slow their rate of shrinkage, and that companies with growing free cash flow will see their growth rate slow, over this period. We do this to reflect that growth tends to slow more in the early years than it does in later years.
Generally we assume that a dollar today is more valuable than a dollar in the future, and so the sum of these future cash flows is then discounted to today's value:
10-year free cash flow (FCF) estimate
| 2024 | 2025 | 2026 | 2027 | 2028 | 2029 | 2030 | 2031 | 2032 | 2033 | |
| Levered FCF ($, Millions) | US$10.3m | US$78.8m | US$210.5m | US$244.8m | US$270.0m | US$291.3m | US$309.1m | US$324.4m | US$337.6m | US$349.4m |
| Growth Rate Estimate Source | Analyst x4 | Analyst x4 | Analyst x3 | Analyst x2 | Est @ 10.33% | Est @ 7.86% | Est @ 6.14% | Est @ 4.93% | Est @ 4.08% | Est @ 3.49% |
| Present Value ($, Millions) Discounted @ 7.5% | US$9.6 | US$68.2 | US$170 | US$183 | US$188 | US$189 | US$187 | US$182 | US$176 | US$170 |
("Est" = FCF growth rate estimated by Simply Wall St)
Present Value of 10-year Cash Flow (PVCF) = US$1.5b
The second stage is also known as Terminal Value, this is the business's cash flow after the first stage. The Gordon Growth formula is used to calculate Terminal Value at a future annual growth rate equal to the 5-year average of the 10-year government bond yield of 2.1%. We discount the terminal cash flows to today's value at a cost of equity of 7.5%.
Terminal Value (TV)= FCF2033 × (1 + g) ÷ (r – g) = US$349m× (1 + 2.1%) ÷ (7.5%– 2.1%) = US$6.6b
Present Value of Terminal Value (PVTV)= TV / (1 + r)10= US$6.6b÷ ( 1 + 7.5%)10= US$3.2b
The total value is the sum of cash flows for the next ten years plus the discounted terminal value, which results in the Total Equity Value, which in this case is US$4.8b. In the final step we divide the equity value by the number of shares outstanding. Relative to the current share price of US$17.6, the company appears quite good value at a 41% discount to where the stock price trades currently. Valuations are imprecise instruments though, rather like a telescope - move a few degrees and end up in a different galaxy. Do keep this in mind.
The Assumptions
Now the most important inputs to a discounted cash flow are the discount rate, and of course, the actual cash flows. Part of investing is coming up with your own evaluation of a company's future performance, so try the calculation yourself and check your own assumptions. The DCF also does not consider the possible cyclicality of an industry, or a company's future capital requirements, so it does not give a full picture of a company's potential performance. Given that we are looking at ACV Auctions as potential shareholders, the cost of equity is used as the discount rate, rather than the cost of capital (or weighted average cost of capital, WACC) which accounts for debt. In this calculation we've used 7.5%, which is based on a levered beta of 0.904. Beta is a measure of a stock's volatility, compared to the market as a whole. We get our beta from the industry average beta of globally comparable companies, with an imposed limit between 0.8 and 2.0, which is a reasonable range for a stable business.
SWOT Analysis for ACV Auctions
- Debt is well covered by earnings.
- No major weaknesses identified for ACVA.
- Forecast to reduce losses next year.
- Has sufficient cash runway for more than 3 years based on current free cash flows.
- Trading below our estimate of fair value by more than 20%.
- Debt is not well covered by operating cash flow.
Moving On:
Whilst important, the DCF calculation shouldn't be the only metric you look at when researching a company. It's not possible to obtain a foolproof valuation with a DCF model. Instead the best use for a DCF model is to test certain assumptions and theories to see if they would lead to the company being undervalued or overvalued. For instance, if the terminal value growth rate is adjusted slightly, it can dramatically alter the overall result. Why is the intrinsic value higher than the current share price? For ACV Auctions, there are three further items you should explore:
- Risks: As an example, we've found 1 warning sign for ACV Auctions that you need to consider before investing here.
- Future Earnings: How does ACVA's growth rate compare to its peers and the wider market? Dig deeper into the analyst consensus number for the upcoming years by interacting with our free analyst growth expectation chart.
- Other High Quality Alternatives: Do you like a good all-rounder? Explore our interactive list of high quality stocks to get an idea of what else is out there you may be missing!
PS. The Simply Wall St app conducts a discounted cash flow valuation for every stock on the NASDAQGS every day. If you want to find the calculation for other stocks just search here.
New: Manage All Your Stock Portfolios in One Place
We've created the ultimate portfolio companion for stock investors, and it's free.
• Connect an unlimited number of Portfolios and see your total in one currency
• Be alerted to new Warning Signs or Risks via email or mobile
• Track the Fair Value of your stocks
Have feedback on this article? Concerned about the content? Get in touch with us directly. Alternatively, email editorial-team (at) simplywallst.com.
This article by Simply Wall St is general in nature. We provide commentary based on historical data and analyst forecasts only using an unbiased methodology and our articles are not intended to be financial advice. It does not constitute a recommendation to buy or sell any stock, and does not take account of your objectives, or your financial situation. We aim to bring you long-term focused analysis driven by fundamental data. Note that our analysis may not factor in the latest price-sensitive company announcements or qualitative material. Simply Wall St has no position in any stocks mentioned.
About NasdaqGS:ACVA
ACV Auctions
Provides a wholesale auction marketplace to facilitate business-to-business used vehicle sales between a selling and buying dealership.
High growth potential with excellent balance sheet.

