- United States
- /
- Electrical
- /
- NYSE:WBX
Wallbox N.V.'s (NYSE:WBX) P/S Is Still On The Mark Following 34% Share Price Bounce


Wallbox N.V. (NYSE:WBX) shareholders would be excited to see that the share price has had a great month, posting a 34% gain and recovering from prior weakness. Still, the 30-day jump doesn't change the fact that longer term shareholders have seen their stock decimated by the 51% share price drop in the last twelve months.
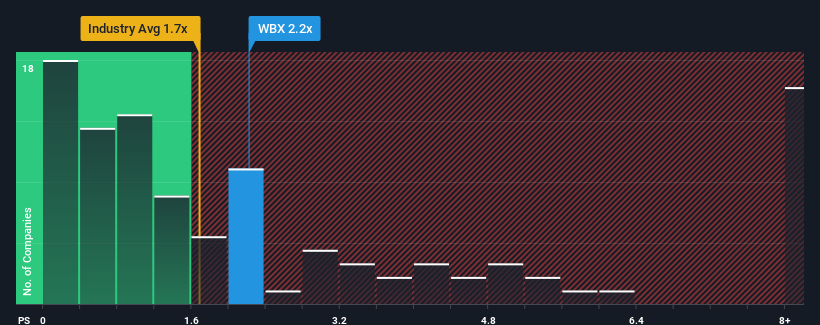
Following the firm bounce in price, you could be forgiven for thinking Wallbox is a stock not worth researching with a price-to-sales ratios (or "P/S") of 2.2x, considering almost half the companies in the United States' Electrical industry have P/S ratios below 1.7x. Although, it's not wise to just take the P/S at face value as there may be an explanation why it's as high as it is.
View our latest analysis for Wallbox
How Has Wallbox Performed Recently?
While the industry has experienced revenue growth lately, Wallbox's revenue has gone into reverse gear, which is not great. One possibility is that the P/S ratio is high because investors think this poor revenue performance will turn the corner. However, if this isn't the case, investors might get caught out paying too much for the stock.
If you'd like to see what analysts are forecasting going forward, you should check out our free report on Wallbox.What Are Revenue Growth Metrics Telling Us About The High P/S?
In order to justify its P/S ratio, Wallbox would need to produce impressive growth in excess of the industry.
Taking a look back first, we see that there was hardly any revenue growth to speak of for the company over the past year. Spectacularly, three year revenue growth has ballooned by several orders of magnitude, even though the last 12 months were nothing to write home about. Therefore, it's fair to say the revenue growth recently has been superb for the company, but investors will want to ask why it has slowed to such an extent.
Turning to the outlook, the next three years should generate growth of 55% per year as estimated by the five analysts watching the company. With the industry only predicted to deliver 45% per annum, the company is positioned for a stronger revenue result.
In light of this, it's understandable that Wallbox's P/S sits above the majority of other companies. Apparently shareholders aren't keen to offload something that is potentially eyeing a more prosperous future.
The Final Word
The large bounce in Wallbox's shares has lifted the company's P/S handsomely. Using the price-to-sales ratio alone to determine if you should sell your stock isn't sensible, however it can be a practical guide to the company's future prospects.
As we suspected, our examination of Wallbox's analyst forecasts revealed that its superior revenue outlook is contributing to its high P/S. It appears that shareholders are confident in the company's future revenues, which is propping up the P/S. Unless these conditions change, they will continue to provide strong support to the share price.
We don't want to rain on the parade too much, but we did also find 3 warning signs for Wallbox that you need to be mindful of.
If strong companies turning a profit tickle your fancy, then you'll want to check out this free list of interesting companies that trade on a low P/E (but have proven they can grow earnings).
Valuation is complex, but we're here to simplify it.
Discover if Wallbox might be undervalued or overvalued with our detailed analysis, featuring fair value estimates, potential risks, dividends, insider trades, and its financial condition.
Access Free AnalysisHave feedback on this article? Concerned about the content? Get in touch with us directly. Alternatively, email editorial-team (at) simplywallst.com.
This article by Simply Wall St is general in nature. We provide commentary based on historical data and analyst forecasts only using an unbiased methodology and our articles are not intended to be financial advice. It does not constitute a recommendation to buy or sell any stock, and does not take account of your objectives, or your financial situation. We aim to bring you long-term focused analysis driven by fundamental data. Note that our analysis may not factor in the latest price-sensitive company announcements or qualitative material. Simply Wall St has no position in any stocks mentioned.
Have feedback on this article? Concerned about the content? Get in touch with us directly. Alternatively, email editorial-team@simplywallst.com
About NYSE:WBX
Wallbox
A technology company, designs, manufactures, and distributes charging solutions for residential, business, and public use worldwide.
High growth potential and fair value.
Similar Companies
Market Insights

Community Narratives

