

Legendary fund manager Li Lu (who Charlie Munger backed) once said, 'The biggest investment risk is not the volatility of prices, but whether you will suffer a permanent loss of capital.' When we think about how risky a company is, we always like to look at its use of debt, since debt overload can lead to ruin. We can see that Vertiv Holdings Co (NYSE:VRT) does use debt in its business. But the more important question is: how much risk is that debt creating?
Why Does Debt Bring Risk?
Debt and other liabilities become risky for a business when it cannot easily fulfill those obligations, either with free cash flow or by raising capital at an attractive price. Ultimately, if the company can't fulfill its legal obligations to repay debt, shareholders could walk away with nothing. However, a more usual (but still expensive) situation is where a company must dilute shareholders at a cheap share price simply to get debt under control. Of course, plenty of companies use debt to fund growth, without any negative consequences. The first step when considering a company's debt levels is to consider its cash and debt together.
See our latest analysis for Vertiv Holdings Co
How Much Debt Does Vertiv Holdings Co Carry?
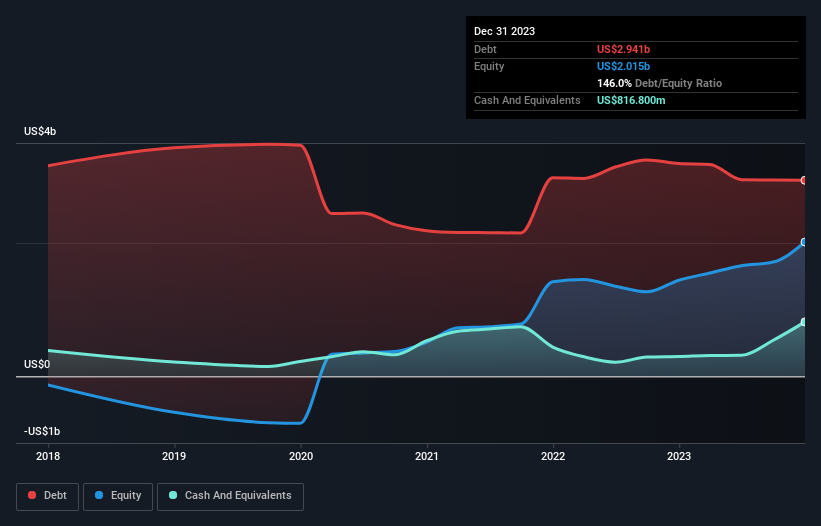
You can click the graphic below for the historical numbers, but it shows that Vertiv Holdings Co had US$2.94b of debt in December 2023, down from US$3.19b, one year before. However, it also had US$816.8m in cash, and so its net debt is US$2.12b.
How Strong Is Vertiv Holdings Co's Balance Sheet?
We can see from the most recent balance sheet that Vertiv Holdings Co had liabilities of US$2.31b falling due within a year, and liabilities of US$3.68b due beyond that. On the other hand, it had cash of US$816.8m and US$2.19b worth of receivables due within a year. So its liabilities outweigh the sum of its cash and (near-term) receivables by US$2.98b.
Of course, Vertiv Holdings Co has a titanic market capitalization of US$26.5b, so these liabilities are probably manageable. But there are sufficient liabilities that we would certainly recommend shareholders continue to monitor the balance sheet, going forward.
We use two main ratios to inform us about debt levels relative to earnings. The first is net debt divided by earnings before interest, tax, depreciation, and amortization (EBITDA), while the second is how many times its earnings before interest and tax (EBIT) covers its interest expense (or its interest cover, for short). This way, we consider both the absolute quantum of the debt, as well as the interest rates paid on it.
Vertiv Holdings Co's net debt is sitting at a very reasonable 1.8 times its EBITDA, while its EBIT covered its interest expense just 5.1 times last year. While these numbers do not alarm us, it's worth noting that the cost of the company's debt is having a real impact. Notably, Vertiv Holdings Co's EBIT launched higher than Elon Musk, gaining a whopping 309% on last year. The balance sheet is clearly the area to focus on when you are analysing debt. But it is future earnings, more than anything, that will determine Vertiv Holdings Co's ability to maintain a healthy balance sheet going forward. So if you're focused on the future you can check out this free report showing analyst profit forecasts.
But our final consideration is also important, because a company cannot pay debt with paper profits; it needs cold hard cash. So the logical step is to look at the proportion of that EBIT that is matched by actual free cash flow. In the last three years, Vertiv Holdings Co's free cash flow amounted to 44% of its EBIT, less than we'd expect. That weak cash conversion makes it more difficult to handle indebtedness.
Our View
Vertiv Holdings Co's EBIT growth rate suggests it can handle its debt as easily as Cristiano Ronaldo could score a goal against an under 14's goalkeeper. And we also thought its level of total liabilities was a positive. All these things considered, it appears that Vertiv Holdings Co can comfortably handle its current debt levels. On the plus side, this leverage can boost shareholder returns, but the potential downside is more risk of loss, so it's worth monitoring the balance sheet. The balance sheet is clearly the area to focus on when you are analysing debt. However, not all investment risk resides within the balance sheet - far from it. To that end, you should be aware of the 1 warning sign we've spotted with Vertiv Holdings Co .
When all is said and done, sometimes its easier to focus on companies that don't even need debt. Readers can access a list of growth stocks with zero net debt 100% free, right now.
New: Manage All Your Stock Portfolios in One Place
We've created the ultimate portfolio companion for stock investors, and it's free.
• Connect an unlimited number of Portfolios and see your total in one currency
• Be alerted to new Warning Signs or Risks via email or mobile
• Track the Fair Value of your stocks
Have feedback on this article? Concerned about the content? Get in touch with us directly. Alternatively, email editorial-team (at) simplywallst.com.
This article by Simply Wall St is general in nature. We provide commentary based on historical data and analyst forecasts only using an unbiased methodology and our articles are not intended to be financial advice. It does not constitute a recommendation to buy or sell any stock, and does not take account of your objectives, or your financial situation. We aim to bring you long-term focused analysis driven by fundamental data. Note that our analysis may not factor in the latest price-sensitive company announcements or qualitative material. Simply Wall St has no position in any stocks mentioned.
About NYSE:VRT
Vertiv Holdings Co
Designs, manufactures, and services critical digital infrastructure technologies and life cycle services for data centers, communication networks, and commercial and industrial environments in the Americas, the Asia Pacific, Europe, the Middle East, and Africa.
High growth potential with excellent balance sheet.
Similar Companies
Market Insights

Community Narratives

