
Advertisement
- United States
- /
- Machinery
- /
- NYSE:SNA
These 4 Measures Indicate That Snap-on (NYSE:SNA) Is Using Debt Reasonably Well
Warren Buffett famously said, 'Volatility is far from synonymous with risk.' When we think about how risky a company is, we always like to look at its use of debt, since debt overload can lead to ruin. As with many other companies Snap-on Incorporated (NYSE:SNA) makes use of debt. But the real question is whether this debt is making the company risky.
Why Does Debt Bring Risk?
Debt assists a business until the business has trouble paying it off, either with new capital or with free cash flow. If things get really bad, the lenders can take control of the business. However, a more frequent (but still costly) occurrence is where a company must issue shares at bargain-basement prices, permanently diluting shareholders, just to shore up its balance sheet. By replacing dilution, though, debt can be an extremely good tool for businesses that need capital to invest in growth at high rates of return. The first thing to do when considering how much debt a business uses is to look at its cash and debt together.
See our latest analysis for Snap-on
What Is Snap-on's Debt?
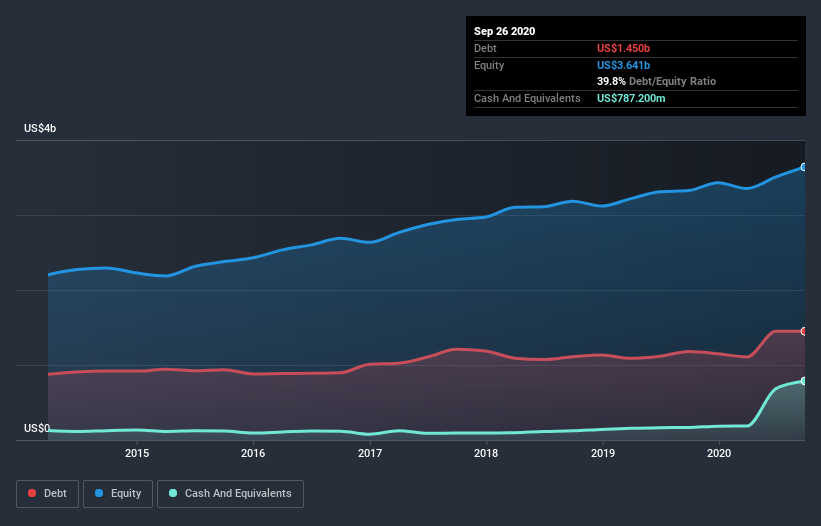
As you can see below, at the end of September 2020, Snap-on had US$1.45b of debt, up from US$1.18b a year ago. Click the image for more detail. However, it does have US$787.2m in cash offsetting this, leading to net debt of about US$662.5m.
A Look At Snap-on's Liabilities
According to the last reported balance sheet, Snap-on had liabilities of US$1.12b due within 12 months, and liabilities of US$1.51b due beyond 12 months. On the other hand, it had cash of US$787.2m and US$624.8m worth of receivables due within a year. So it has liabilities totalling US$1.21b more than its cash and near-term receivables, combined.
Since publicly traded Snap-on shares are worth a total of US$9.72b, it seems unlikely that this level of liabilities would be a major threat. Having said that, it's clear that we should continue to monitor its balance sheet, lest it change for the worse.
We use two main ratios to inform us about debt levels relative to earnings. The first is net debt divided by earnings before interest, tax, depreciation, and amortization (EBITDA), while the second is how many times its earnings before interest and tax (EBIT) covers its interest expense (or its interest cover, for short). Thus we consider debt relative to earnings both with and without depreciation and amortization expenses.
Snap-on has a low net debt to EBITDA ratio of only 0.70. And its EBIT covers its interest expense a whopping 17.6 times over. So you could argue it is no more threatened by its debt than an elephant is by a mouse. But the bad news is that Snap-on has seen its EBIT plunge 10% in the last twelve months. If that rate of decline in earnings continues, the company could find itself in a tight spot. There's no doubt that we learn most about debt from the balance sheet. But ultimately the future profitability of the business will decide if Snap-on can strengthen its balance sheet over time. So if you want to see what the professionals think, you might find this free report on analyst profit forecasts to be interesting.
But our final consideration is also important, because a company cannot pay debt with paper profits; it needs cold hard cash. So we clearly need to look at whether that EBIT is leading to corresponding free cash flow. During the last three years, Snap-on produced sturdy free cash flow equating to 74% of its EBIT, about what we'd expect. This cold hard cash means it can reduce its debt when it wants to.
Our View
The good news is that Snap-on's demonstrated ability to cover its interest expense with its EBIT delights us like a fluffy puppy does a toddler. But we must concede we find its EBIT growth rate has the opposite effect. Taking all this data into account, it seems to us that Snap-on takes a pretty sensible approach to debt. While that brings some risk, it can also enhance returns for shareholders. Above most other metrics, we think its important to track how fast earnings per share is growing, if at all. If you've also come to that realization, you're in luck, because today you can view this interactive graph of Snap-on's earnings per share history for free.
When all is said and done, sometimes its easier to focus on companies that don't even need debt. Readers can access a list of growth stocks with zero net debt 100% free, right now.
If you’re looking to trade Snap-on, open an account with the lowest-cost* platform trusted by professionals, Interactive Brokers. Their clients from over 200 countries and territories trade stocks, options, futures, forex, bonds and funds worldwide from a single integrated account. Promoted
New: Manage All Your Stock Portfolios in One Place
We've created the ultimate portfolio companion for stock investors, and it's free.
• Connect an unlimited number of Portfolios and see your total in one currency
• Be alerted to new Warning Signs or Risks via email or mobile
• Track the Fair Value of your stocks
This article by Simply Wall St is general in nature. It does not constitute a recommendation to buy or sell any stock, and does not take account of your objectives, or your financial situation. We aim to bring you long-term focused analysis driven by fundamental data. Note that our analysis may not factor in the latest price-sensitive company announcements or qualitative material. Simply Wall St has no position in any stocks mentioned.
*Interactive Brokers Rated Lowest Cost Broker by StockBrokers.com Annual Online Review 2020
Have feedback on this article? Concerned about the content? Get in touch with us directly. Alternatively, email editorial-team (at) simplywallst.com.
About NYSE:SNA
Snap-on
Manufactures and markets tools, equipment, diagnostics, and repair information and systems solutions for professional users worldwide.
Flawless balance sheet, undervalued and pays a dividend.
Similar Companies
Market Insights

Advertisement
Community Narratives
The "Molecular Pencil": Why Beam's Technology is Built to Win
Fair Value US$65.01|65.4% undervalued
DA
Community Contributor
The silent giant behind virtually every advanced chip powering AI, smartphones, and modern infrastructure.
Fair Value US$310.00|6.1% undervalued
OS
Community Contributor
ADP Stock: Solid Fundamentals, But AI Investments Test Its Margin Resilience
Fair Value US$387.77|34.2% undervalued
YI
Community Contributor
MINISO's fair value is projected at 26.69 with an anticipated PE ratio shift of 20x
Fair Value US$24.03|9.6% undervalued
BE
Community Contributor