Advertisement
- United States
- /
- Electrical
- /
- NYSE:RRX
Assessing Regal Rexnord’s Value After Recent Sector Consolidation Headlines and Price Recovery

Simply Wall St
Reviewed by Bailey Pemberton
If you have been eyeing Regal Rexnord and wondering, “What should I do next?” you are not alone. Investors are trying to navigate the waters after seeing the stock trade at $145.04 most recently, with a modest 1.3% gain over the past week and a 1.1% uptick for the past month. Still, Regal Rexnord’s longer-term chart tells a more mixed story: shares are down 5.4% year-to-date and off 13.7% from where they stood a year ago. Those who have held on for five years are sitting on a 69.1% return.
What is driving these swings? Alongside shifting investor sentiment about industrial and manufacturing plays like Regal Rexnord, recent headlines have added to the intrigue. Changes in the company’s product portfolio, coupled with market chatter around sector consolidation, have brought the company back onto the radar of both value and growth investors. Although this coverage sparked some near-term optimism, it is clear that the market’s view on Regal Rexnord has also reflected broader questions about the pace of economic recovery and potential changes in demand across its key end markets.
So, is the stock undervalued at these levels? According to our scorecard, Regal Rexnord checks three out of six boxes for undervaluation, earning a respectable valuation score of 3. In the next section, we will break down how the company stacks up according to different valuation metrics and hint at an even more insightful way to judge whether this stock truly belongs in your portfolio.
Why Regal Rexnord is lagging behind its peers
Approach 1: Regal Rexnord Discounted Cash Flow (DCF) Analysis
The Discounted Cash Flow (DCF) model is a valuation approach that estimates the present value of a company by projecting its future cash flows and discounting them back to today. This method helps investors understand what the business might be worth based solely on how much cash it is expected to generate in the years ahead.
For Regal Rexnord, the model uses a 2 Stage Free Cash Flow to Equity approach. The company's latest twelve months (LTM) Free Cash Flow stands at $885.9 million. Analysts provide cash flow projections through 2027, estimating Free Cash Flow of $939 million by then. Beyond that, projections are extended by Simply Wall St, with ten-year estimates reaching roughly $1.14 billion by 2035. This projection reflects reasonable, steady growth in cash generation, which is a strong sign for long-term valuation.
After discounting these expected cash flows back to the present, the DCF model calculates Regal Rexnord's intrinsic value at $173.05 per share. With the current market price hovering around $145, the DCF suggests the stock is trading at a 16.2% discount. This indicates it may be undervalued compared to its long-term cash-generating potential.
Result: UNDERVALUED
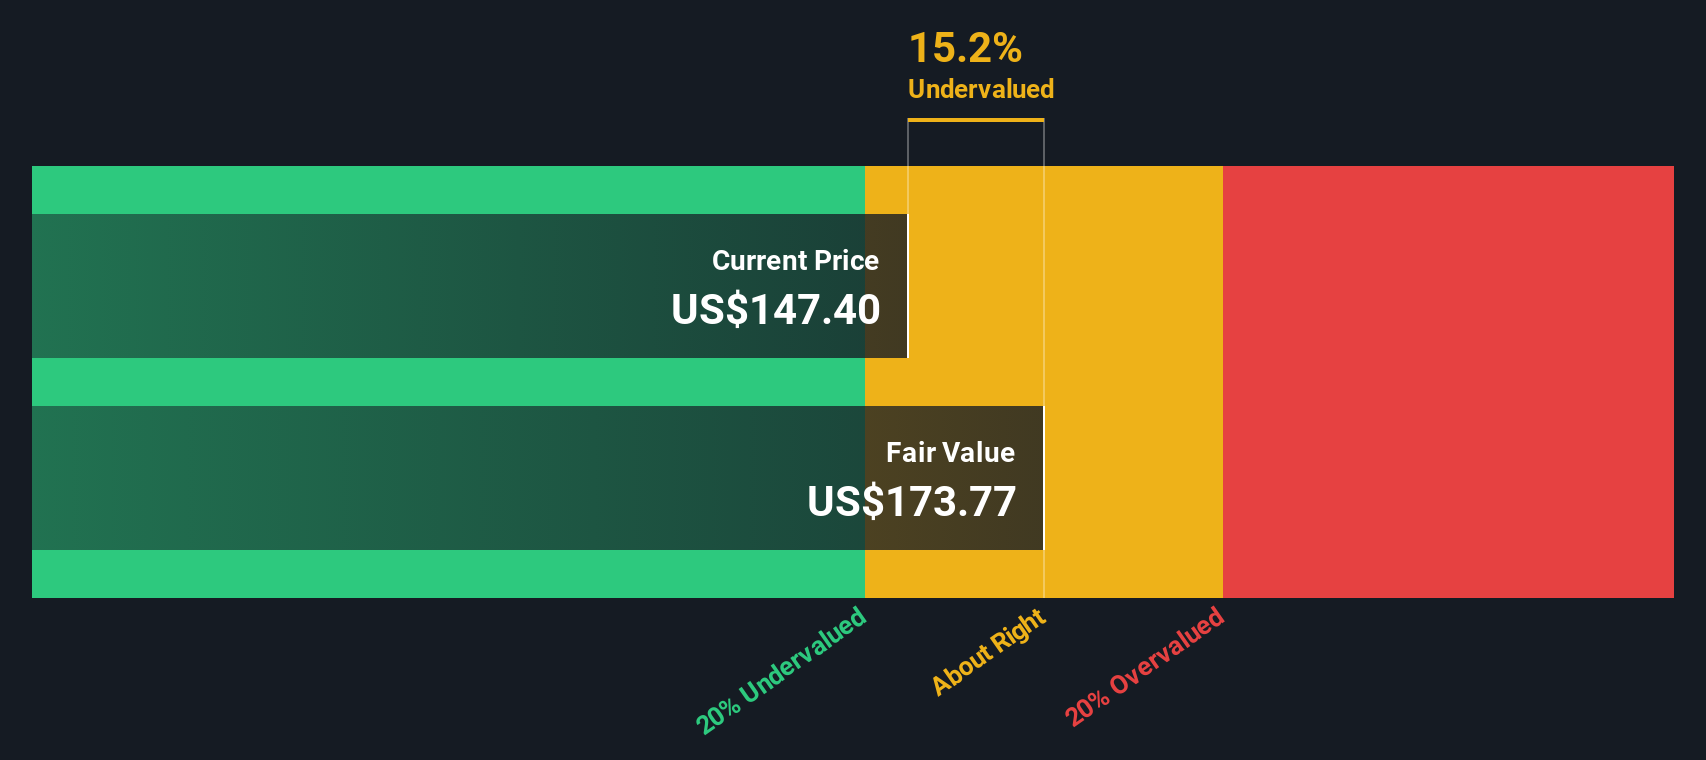
Our Discounted Cash Flow (DCF) analysis suggests Regal Rexnord is undervalued by 16.2%. Track this in your watchlist or portfolio, or discover more undervalued stocks.
Approach 2: Regal Rexnord Price vs Earnings (P/E Ratio)
The Price-to-Earnings (P/E) ratio is a popular tool for valuing established, profitable companies like Regal Rexnord. Since this metric relates a company’s share price to its earnings, it is especially relevant for investors looking to gauge how much they are paying for each dollar of profit. Higher growth expectations, strong returns, and lower perceived risks tend to justify a higher P/E, while slower growth or greater risks might mean a lower, more “normal” ratio is reasonable.
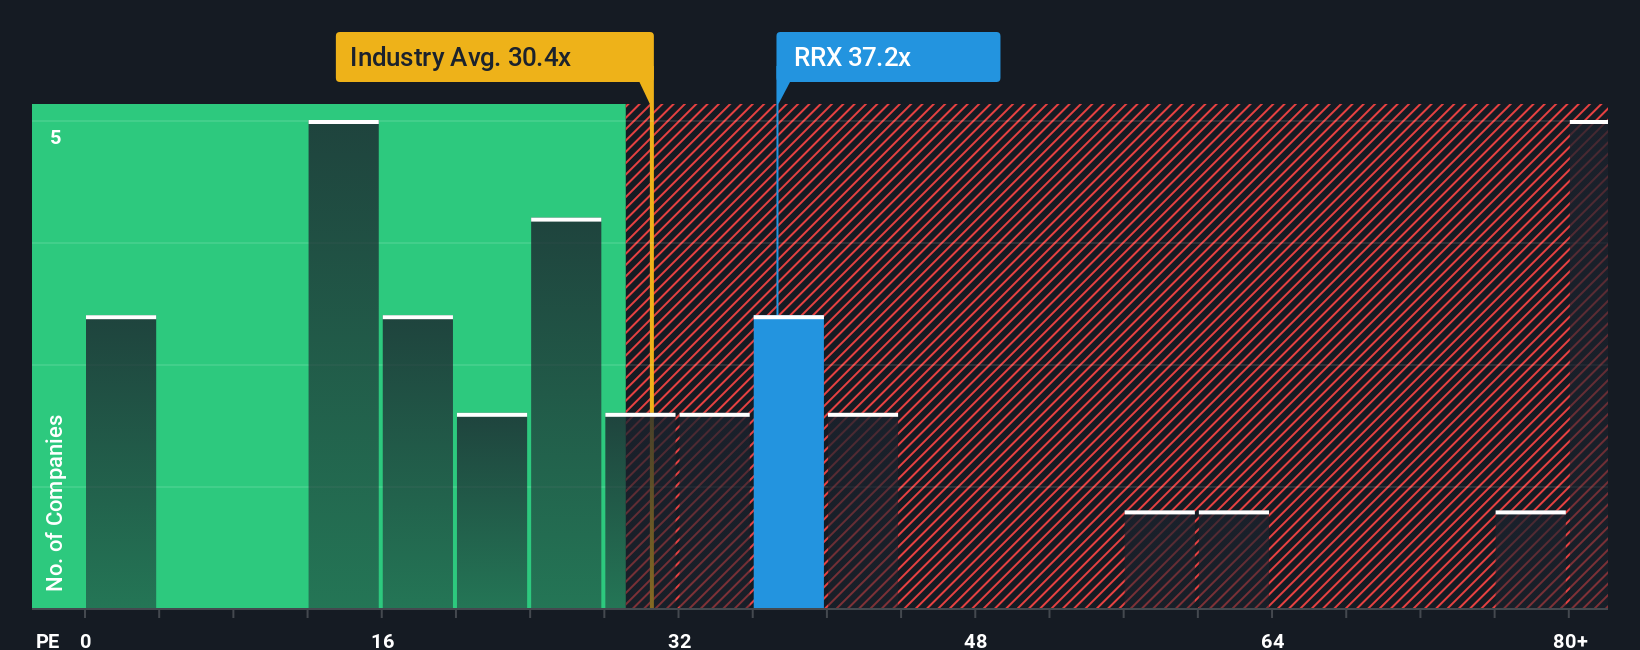
Currently, Regal Rexnord trades at a P/E of 38.4x. Compared to its peer average of 36.7x, Regal Rexnord’s ratio appears slightly higher. Against the broader Electrical industry, which features a P/E average of 31.0x, the company also sits above the average. However, simple comparisons do not tell the whole story, as peers and industry averages can reflect a wide range of business models and risk profiles.
Simply Wall St’s proprietary “Fair Ratio” provides further insight. By factoring in Regal Rexnord’s unique attributes, including earnings growth, profit margins, risks, and market cap, it offers a nuanced view of what a reasonable P/E should be. For Regal Rexnord, the fair P/E is calculated at 48.0x, higher than both its current level and the industry or peer averages. This suggests the market may be undervaluing the company based on its fundamentals and prospects.
Result: UNDERVALUED
PE ratios tell one story, but what if the real opportunity lies elsewhere? Discover companies where insiders are betting big on explosive growth.
Upgrade Your Decision Making: Choose your Regal Rexnord Narrative
Earlier, we mentioned there is an even better way to understand a company’s value than just traditional metrics, so let’s introduce you to Narratives.
A Narrative is a simple but powerful tool that allows investors to build their own story about a company by combining personal perspectives on its future with forecasts of revenue, earnings, and margins, then linking that story directly to a fair value estimate. Narratives connect what you believe about Regal Rexnord’s outlook to what the stock should be worth, letting you move beyond one-size-fits-all numbers.
On Simply Wall St’s Community page, millions of investors can easily create and update their Narratives, making it accessible for both new and experienced users. These Narratives help you decide if and when to buy or sell by comparing your fair value to the stock’s current price, and they refresh automatically as new news, analyst estimates, or earnings updates arrive, so your viewpoint is always up to date.
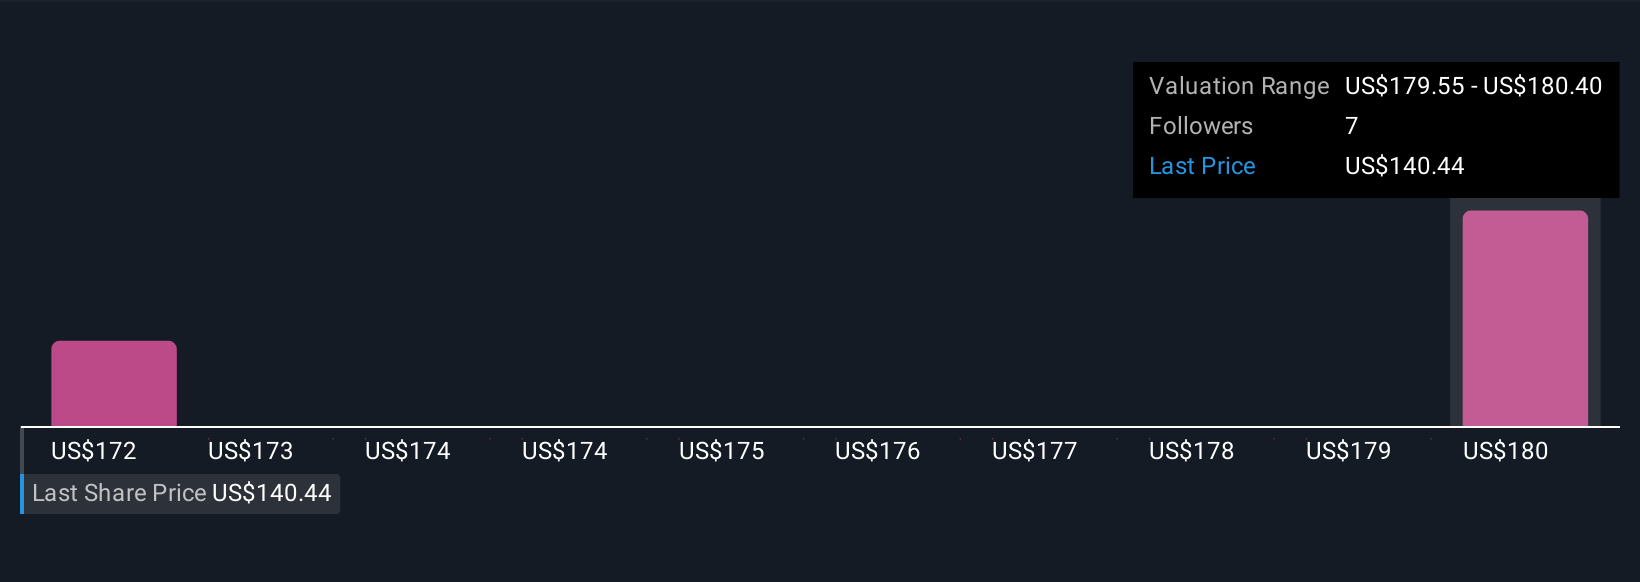
For Regal Rexnord, some investors’ Narratives project a future fair value as high as $204, while others take a more cautious outlook at $163. This range shows how the story you believe shapes your investment decision. A higher fair value reflects confidence in the company’s growth in energy efficiency and automation, while a lower estimate signals more caution about risks and sector headwinds.
Do you think there's more to the story for Regal Rexnord? Create your own Narrative to let the Community know!
This article by Simply Wall St is general in nature. We provide commentary based on historical data and analyst forecasts only using an unbiased methodology and our articles are not intended to be financial advice. It does not constitute a recommendation to buy or sell any stock, and does not take account of your objectives, or your financial situation. We aim to bring you long-term focused analysis driven by fundamental data. Note that our analysis may not factor in the latest price-sensitive company announcements or qualitative material. Simply Wall St has no position in any stocks mentioned.
New: AI Stock Screener & Alerts
Our new AI Stock Screener scans the market every day to uncover opportunities.
• Dividend Powerhouses (3%+ Yield)
• Undervalued Small Caps with Insider Buying
• High growth Tech and AI Companies
Or build your own from over 50 metrics.
Have feedback on this article? Concerned about the content? Get in touch with us directly. Alternatively, email editorial-team@simplywallst.com
About NYSE:RRX
Regal Rexnord
Provides sustainable solutions for power, transmit, and control motion products in the North America, Asia, Europe, and internationally.
Average dividend payer and fair value.
Similar Companies
Market Insights

Advertisement
Community Narratives
Finding The True Value Of A Logistics Powerhouse
Fair Value US$95.21|8.7% undervalued
NV
Community Contributor
Paradigm Biopharmaceuticals Will Lead Osteoarthritis Treatment with Zilosul's FDA Success
Fair Value AU$5.50|93.3% undervalued
AM
Community Contributor
Barrick Mining (ABX:CA): A Gold Hedge against a U.S. Shutdown
Fair Value CA$60.00|18.7% undervalued
GM
Community Contributor