- United States
- /
- Machinery
- /
- NYSE:REVG
REV Group (NYSE:REVG) climbs 5.2% this week, taking five-year gains to 186%


When you buy shares in a company, it's worth keeping in mind the possibility that it could fail, and you could lose your money. But on the bright side, you can make far more than 100% on a really good stock. For instance, the price of REV Group, Inc. (NYSE:REVG) stock is up an impressive 127% over the last five years. It's also good to see the share price up 22% over the last quarter.
The past week has proven to be lucrative for REV Group investors, so let's see if fundamentals drove the company's five-year performance.
Check out our latest analysis for REV Group
While the efficient markets hypothesis continues to be taught by some, it has been proven that markets are over-reactive dynamic systems, and investors are not always rational. One way to examine how market sentiment has changed over time is to look at the interaction between a company's share price and its earnings per share (EPS).
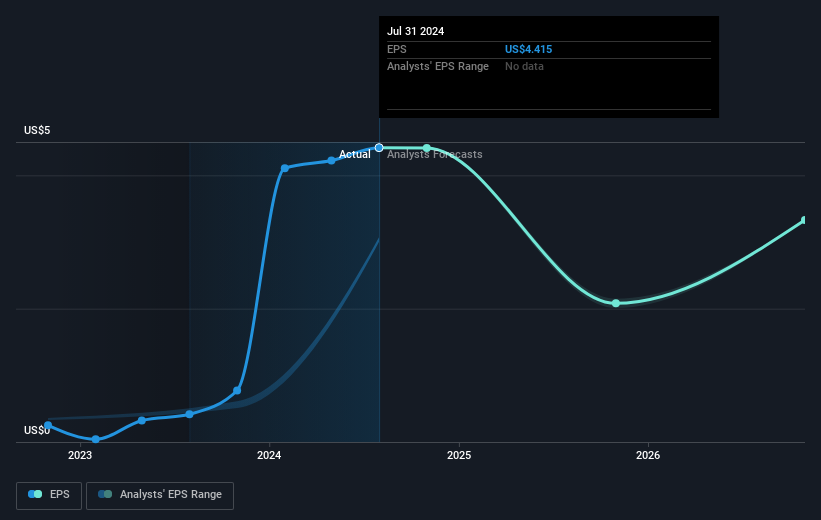
During the last half decade, REV Group became profitable. That kind of transition can be an inflection point that justifies a strong share price gain, just as we have seen here. Given that the company made a profit three years ago, but not five years ago, it is worth looking at the share price returns over the last three years, too. Indeed, the REV Group share price has gained 94% in three years. During the same period, EPS grew by 106% each year. This EPS growth is higher than the 25% average annual increase in the share price over the same three years. Therefore, it seems the market has moderated its expectations for growth, somewhat. This unenthusiastic sentiment is reflected in the stock's reasonably modest P/E ratio of 6.17.
The image below shows how EPS has tracked over time (if you click on the image you can see greater detail).
We know that REV Group has improved its bottom line over the last three years, but what does the future have in store? This free interactive report on REV Group's balance sheet strength is a great place to start, if you want to investigate the stock further.
What About Dividends?
As well as measuring the share price return, investors should also consider the total shareholder return (TSR). The TSR incorporates the value of any spin-offs or discounted capital raisings, along with any dividends, based on the assumption that the dividends are reinvested. Arguably, the TSR gives a more comprehensive picture of the return generated by a stock. We note that for REV Group the TSR over the last 5 years was 186%, which is better than the share price return mentioned above. And there's no prize for guessing that the dividend payments largely explain the divergence!
A Different Perspective
We're pleased to report that REV Group shareholders have received a total shareholder return of 123% over one year. That's including the dividend. Since the one-year TSR is better than the five-year TSR (the latter coming in at 23% per year), it would seem that the stock's performance has improved in recent times. In the best case scenario, this may hint at some real business momentum, implying that now could be a great time to delve deeper. I find it very interesting to look at share price over the long term as a proxy for business performance. But to truly gain insight, we need to consider other information, too. To that end, you should learn about the 4 warning signs we've spotted with REV Group (including 3 which don't sit too well with us) .
If you are like me, then you will not want to miss this free list of undervalued small caps that insiders are buying.
Please note, the market returns quoted in this article reflect the market weighted average returns of stocks that currently trade on American exchanges.
New: AI Stock Screener & Alerts
Our new AI Stock Screener scans the market every day to uncover opportunities.
• Dividend Powerhouses (3%+ Yield)
• Undervalued Small Caps with Insider Buying
• High growth Tech and AI Companies
Or build your own from over 50 metrics.
Have feedback on this article? Concerned about the content? Get in touch with us directly. Alternatively, email editorial-team (at) simplywallst.com.
This article by Simply Wall St is general in nature. We provide commentary based on historical data and analyst forecasts only using an unbiased methodology and our articles are not intended to be financial advice. It does not constitute a recommendation to buy or sell any stock, and does not take account of your objectives, or your financial situation. We aim to bring you long-term focused analysis driven by fundamental data. Note that our analysis may not factor in the latest price-sensitive company announcements or qualitative material. Simply Wall St has no position in any stocks mentioned.
About NYSE:REVG
REV Group
Designs, manufactures, and distributes specialty vehicles, and related aftermarket parts and services in the United States, Canada, and internationally.
Solid track record with adequate balance sheet.
