- United States
- /
- Machinery
- /
- NYSE:RBC
Is RBC Bearings Incorporated (NYSE:RBC) Expensive For A Reason? A Look At Its Intrinsic Value


Key Insights
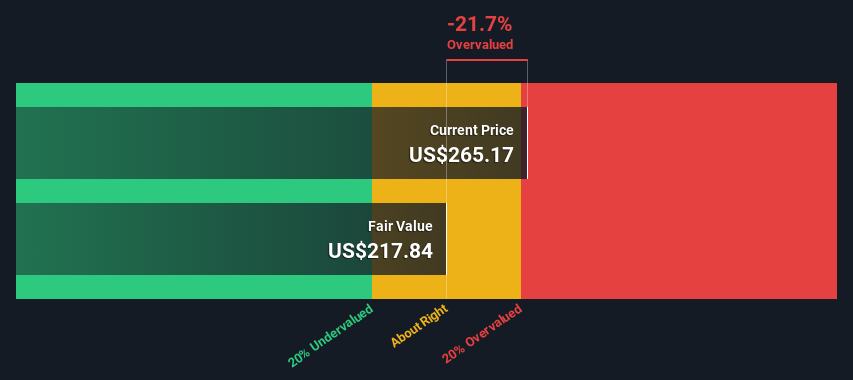
- The projected fair value for RBC Bearings is US$218 based on 2 Stage Free Cash Flow to Equity
- RBC Bearings is estimated to be 22% overvalued based on current share price of US$265
- The US$286 analyst price target for RBC is 31% more than our estimate of fair value
Does the March share price for RBC Bearings Incorporated (NYSE:RBC) reflect what it's really worth? Today, we will estimate the stock's intrinsic value by projecting its future cash flows and then discounting them to today's value. The Discounted Cash Flow (DCF) model is the tool we will apply to do this. There's really not all that much to it, even though it might appear quite complex.
We would caution that there are many ways of valuing a company and, like the DCF, each technique has advantages and disadvantages in certain scenarios. If you still have some burning questions about this type of valuation, take a look at the Simply Wall St analysis model.
View our latest analysis for RBC Bearings
Is RBC Bearings Fairly Valued?
We're using the 2-stage growth model, which simply means we take in account two stages of company's growth. In the initial period the company may have a higher growth rate and the second stage is usually assumed to have a stable growth rate. In the first stage we need to estimate the cash flows to the business over the next ten years. Seeing as no analyst estimates of free cash flow are available to us, we have extrapolate the previous free cash flow (FCF) from the company's last reported value. We assume companies with shrinking free cash flow will slow their rate of shrinkage, and that companies with growing free cash flow will see their growth rate slow, over this period. We do this to reflect that growth tends to slow more in the early years than it does in later years.
Generally we assume that a dollar today is more valuable than a dollar in the future, so we discount the value of these future cash flows to their estimated value in today's dollars:
10-year free cash flow (FCF) forecast
| 2024 | 2025 | 2026 | 2027 | 2028 | 2029 | 2030 | 2031 | 2032 | 2033 | |
| Levered FCF ($, Millions) | US$258.1m | US$285.8m | US$309.3m | US$329.2m | US$346.2m | US$361.2m | US$374.6m | US$386.9m | US$398.4m | US$409.5m |
| Growth Rate Estimate Source | Est @ 14.35% | Est @ 10.73% | Est @ 8.20% | Est @ 6.43% | Est @ 5.19% | Est @ 4.32% | Est @ 3.71% | Est @ 3.28% | Est @ 2.99% | Est @ 2.78% |
| Present Value ($, Millions) Discounted @ 7.4% | US$240 | US$248 | US$250 | US$247 | US$242 | US$235 | US$227 | US$218 | US$209 | US$200 |
("Est" = FCF growth rate estimated by Simply Wall St)
Present Value of 10-year Cash Flow (PVCF) = US$2.3b
After calculating the present value of future cash flows in the initial 10-year period, we need to calculate the Terminal Value, which accounts for all future cash flows beyond the first stage. For a number of reasons a very conservative growth rate is used that cannot exceed that of a country's GDP growth. In this case we have used the 5-year average of the 10-year government bond yield (2.3%) to estimate future growth. In the same way as with the 10-year 'growth' period, we discount future cash flows to today's value, using a cost of equity of 7.4%.
Terminal Value (TV)= FCF2033 × (1 + g) ÷ (r – g) = US$409m× (1 + 2.3%) ÷ (7.4%– 2.3%) = US$8.2b
Present Value of Terminal Value (PVTV)= TV / (1 + r)10= US$8.2b÷ ( 1 + 7.4%)10= US$4.0b
The total value, or equity value, is then the sum of the present value of the future cash flows, which in this case is US$6.3b. In the final step we divide the equity value by the number of shares outstanding. Compared to the current share price of US$265, the company appears slightly overvalued at the time of writing. Remember though, that this is just an approximate valuation, and like any complex formula - garbage in, garbage out.
Important Assumptions
Now the most important inputs to a discounted cash flow are the discount rate, and of course, the actual cash flows. Part of investing is coming up with your own evaluation of a company's future performance, so try the calculation yourself and check your own assumptions. The DCF also does not consider the possible cyclicality of an industry, or a company's future capital requirements, so it does not give a full picture of a company's potential performance. Given that we are looking at RBC Bearings as potential shareholders, the cost of equity is used as the discount rate, rather than the cost of capital (or weighted average cost of capital, WACC) which accounts for debt. In this calculation we've used 7.4%, which is based on a levered beta of 1.114. Beta is a measure of a stock's volatility, compared to the market as a whole. We get our beta from the industry average beta of globally comparable companies, with an imposed limit between 0.8 and 2.0, which is a reasonable range for a stable business.
SWOT Analysis for RBC Bearings
- Earnings growth over the past year exceeded the industry.
- Debt is well covered by earnings and cashflows.
- Expensive based on P/E ratio and estimated fair value.
- Annual earnings are forecast to grow faster than the American market.
- Annual revenue is forecast to grow slower than the American market.
Next Steps:
Valuation is only one side of the coin in terms of building your investment thesis, and it shouldn't be the only metric you look at when researching a company. DCF models are not the be-all and end-all of investment valuation. Preferably you'd apply different cases and assumptions and see how they would impact the company's valuation. If a company grows at a different rate, or if its cost of equity or risk free rate changes sharply, the output can look very different. Why is the intrinsic value lower than the current share price? For RBC Bearings, there are three additional items you should assess:
- Risks: For example, we've discovered 1 warning sign for RBC Bearings that you should be aware of before investing here.
- Future Earnings: How does RBC's growth rate compare to its peers and the wider market? Dig deeper into the analyst consensus number for the upcoming years by interacting with our free analyst growth expectation chart.
- Other Solid Businesses: Low debt, high returns on equity and good past performance are fundamental to a strong business. Why not explore our interactive list of stocks with solid business fundamentals to see if there are other companies you may not have considered!
PS. The Simply Wall St app conducts a discounted cash flow valuation for every stock on the NYSE every day. If you want to find the calculation for other stocks just search here.
New: AI Stock Screener & Alerts
Our new AI Stock Screener scans the market every day to uncover opportunities.
• Dividend Powerhouses (3%+ Yield)
• Undervalued Small Caps with Insider Buying
• High growth Tech and AI Companies
Or build your own from over 50 metrics.
Have feedback on this article? Concerned about the content? Get in touch with us directly. Alternatively, email editorial-team (at) simplywallst.com.
This article by Simply Wall St is general in nature. We provide commentary based on historical data and analyst forecasts only using an unbiased methodology and our articles are not intended to be financial advice. It does not constitute a recommendation to buy or sell any stock, and does not take account of your objectives, or your financial situation. We aim to bring you long-term focused analysis driven by fundamental data. Note that our analysis may not factor in the latest price-sensitive company announcements or qualitative material. Simply Wall St has no position in any stocks mentioned.
About NYSE:RBC
RBC Bearings
Manufactures and markets engineered precision bearings, components, and systems in the United States and internationally.
Solid track record with adequate balance sheet.
Similar Companies
Market Insights

Community Narratives


