

Key Insights
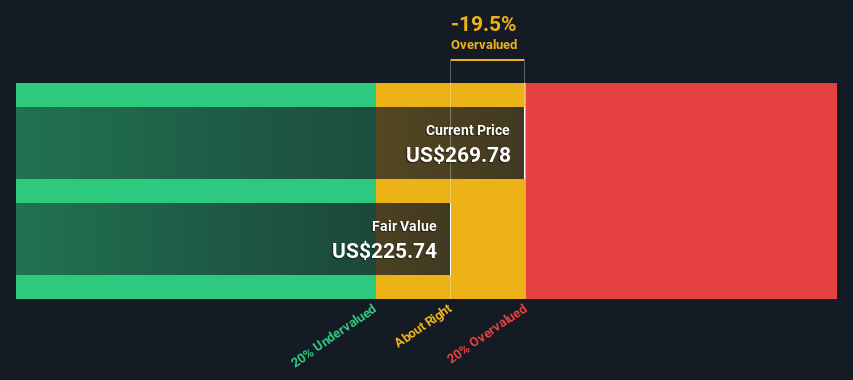
- Using the 2 Stage Free Cash Flow to Equity, RBC Bearings fair value estimate is US$226
- With US$270 share price, RBC Bearings appears to be trading close to its estimated fair value
- The US$300 analyst price target for RBC is 33% more than our estimate of fair value
In this article we are going to estimate the intrinsic value of RBC Bearings Incorporated (NYSE:RBC) by taking the expected future cash flows and discounting them to today's value. One way to achieve this is by employing the Discounted Cash Flow (DCF) model. Don't get put off by the jargon, the math behind it is actually quite straightforward.
We would caution that there are many ways of valuing a company and, like the DCF, each technique has advantages and disadvantages in certain scenarios. If you want to learn more about discounted cash flow, the rationale behind this calculation can be read in detail in the Simply Wall St analysis model.
View our latest analysis for RBC Bearings
Is RBC Bearings Fairly Valued?
We're using the 2-stage growth model, which simply means we take in account two stages of company's growth. In the initial period the company may have a higher growth rate and the second stage is usually assumed to have a stable growth rate. To start off with, we need to estimate the next ten years of cash flows. Where possible we use analyst estimates, but when these aren't available we extrapolate the previous free cash flow (FCF) from the last estimate or reported value. We assume companies with shrinking free cash flow will slow their rate of shrinkage, and that companies with growing free cash flow will see their growth rate slow, over this period. We do this to reflect that growth tends to slow more in the early years than it does in later years.
Generally we assume that a dollar today is more valuable than a dollar in the future, so we need to discount the sum of these future cash flows to arrive at a present value estimate:
10-year free cash flow (FCF) forecast
| 2025 | 2026 | 2027 | 2028 | 2029 | 2030 | 2031 | 2032 | 2033 | 2034 | |
| Levered FCF ($, Millions) | US$298.1m | US$317.4m | US$332.4m | US$345.8m | US$358.1m | US$369.5m | US$380.4m | US$391.0m | US$401.4m | US$411.7m |
| Growth Rate Estimate Source | Analyst x2 | Analyst x2 | Est @ 4.75% | Est @ 4.04% | Est @ 3.54% | Est @ 3.19% | Est @ 2.95% | Est @ 2.78% | Est @ 2.66% | Est @ 2.57% |
| Present Value ($, Millions) Discounted @ 7.4% | US$278 | US$275 | US$268 | US$260 | US$251 | US$241 | US$231 | US$221 | US$211 | US$202 |
("Est" = FCF growth rate estimated by Simply Wall St)
Present Value of 10-year Cash Flow (PVCF) = US$2.4b
After calculating the present value of future cash flows in the initial 10-year period, we need to calculate the Terminal Value, which accounts for all future cash flows beyond the first stage. For a number of reasons a very conservative growth rate is used that cannot exceed that of a country's GDP growth. In this case we have used the 5-year average of the 10-year government bond yield (2.4%) to estimate future growth. In the same way as with the 10-year 'growth' period, we discount future cash flows to today's value, using a cost of equity of 7.4%.
Terminal Value (TV)= FCF2034 × (1 + g) ÷ (r – g) = US$412m× (1 + 2.4%) ÷ (7.4%– 2.4%) = US$8.4b
Present Value of Terminal Value (PVTV)= TV / (1 + r)10= US$8.4b÷ ( 1 + 7.4%)10= US$4.1b
The total value is the sum of cash flows for the next ten years plus the discounted terminal value, which results in the Total Equity Value, which in this case is US$6.6b. The last step is to then divide the equity value by the number of shares outstanding. Relative to the current share price of US$270, the company appears around fair value at the time of writing. Valuations are imprecise instruments though, rather like a telescope - move a few degrees and end up in a different galaxy. Do keep this in mind.
Important Assumptions
We would point out that the most important inputs to a discounted cash flow are the discount rate and of course the actual cash flows. You don't have to agree with these inputs, I recommend redoing the calculations yourself and playing with them. The DCF also does not consider the possible cyclicality of an industry, or a company's future capital requirements, so it does not give a full picture of a company's potential performance. Given that we are looking at RBC Bearings as potential shareholders, the cost of equity is used as the discount rate, rather than the cost of capital (or weighted average cost of capital, WACC) which accounts for debt. In this calculation we've used 7.4%, which is based on a levered beta of 1.090. Beta is a measure of a stock's volatility, compared to the market as a whole. We get our beta from the industry average beta of globally comparable companies, with an imposed limit between 0.8 and 2.0, which is a reasonable range for a stable business.
SWOT Analysis for RBC Bearings
- Earnings growth over the past year exceeded the industry.
- Debt is well covered by earnings and cashflows.
- Expensive based on P/E ratio and estimated fair value.
- Annual earnings are forecast to grow faster than the American market.
- Annual revenue is forecast to grow slower than the American market.
Looking Ahead:
Valuation is only one side of the coin in terms of building your investment thesis, and it is only one of many factors that you need to assess for a company. DCF models are not the be-all and end-all of investment valuation. Instead the best use for a DCF model is to test certain assumptions and theories to see if they would lead to the company being undervalued or overvalued. If a company grows at a different rate, or if its cost of equity or risk free rate changes sharply, the output can look very different. For RBC Bearings, we've compiled three further factors you should consider:
- Risks: We feel that you should assess the 2 warning signs for RBC Bearings we've flagged before making an investment in the company.
- Management:Have insiders been ramping up their shares to take advantage of the market's sentiment for RBC's future outlook? Check out our management and board analysis with insights on CEO compensation and governance factors.
- Other Solid Businesses: Low debt, high returns on equity and good past performance are fundamental to a strong business. Why not explore our interactive list of stocks with solid business fundamentals to see if there are other companies you may not have considered!
PS. The Simply Wall St app conducts a discounted cash flow valuation for every stock on the NYSE every day. If you want to find the calculation for other stocks just search here.
New: AI Stock Screener & Alerts
Our new AI Stock Screener scans the market every day to uncover opportunities.
• Dividend Powerhouses (3%+ Yield)
• Undervalued Small Caps with Insider Buying
• High growth Tech and AI Companies
Or build your own from over 50 metrics.
Have feedback on this article? Concerned about the content? Get in touch with us directly. Alternatively, email editorial-team (at) simplywallst.com.
This article by Simply Wall St is general in nature. We provide commentary based on historical data and analyst forecasts only using an unbiased methodology and our articles are not intended to be financial advice. It does not constitute a recommendation to buy or sell any stock, and does not take account of your objectives, or your financial situation. We aim to bring you long-term focused analysis driven by fundamental data. Note that our analysis may not factor in the latest price-sensitive company announcements or qualitative material. Simply Wall St has no position in any stocks mentioned.
Have feedback on this article? Concerned about the content? Get in touch with us directly. Alternatively, email editorial-team@simplywallst.com
About NYSE:RBC
RBC Bearings
Manufactures and markets engineered precision bearings, components, and systems in the United States and internationally.
Solid track record with adequate balance sheet.
Similar Companies
Market Insights

Community Narratives


