
Advertisement
- United States
- /
- Machinery
- /
- NYSE:PLOW
Shareholders in Douglas Dynamics (NYSE:PLOW) have lost 13%, as stock drops 5.8% this past week
Investors can approximate the average market return by buying an index fund. When you buy individual stocks, you can make higher profits, but you also face the risk of under-performance. Investors in Douglas Dynamics, Inc. (NYSE:PLOW) have tasted that bitter downside in the last year, as the share price dropped 16%. That falls noticeably short of the market return of around 9.2%. The silver lining (for longer term investors) is that the stock is still 1.2% higher than it was three years ago. On top of that, the share price is down 5.8% in the last week. But this could be related to the soft market, which is down about 4.6% in the same period.
If the past week is anything to go by, investor sentiment for Douglas Dynamics isn't positive, so let's see if there's a mismatch between fundamentals and the share price.
View our latest analysis for Douglas Dynamics
In his essay The Superinvestors of Graham-and-Doddsville Warren Buffett described how share prices do not always rationally reflect the value of a business. One imperfect but simple way to consider how the market perception of a company has shifted is to compare the change in the earnings per share (EPS) with the share price movement.
During the last year Douglas Dynamics grew its earnings per share, moving from a loss to a profit.
The result looks like a strong improvement to us, so we're surprised the market has sold down the shares. If the company can sustain the earnings growth, this might be an inflection point for the business, which would make right now a really interesting time to study it more closely.
The graphic below depicts how EPS has changed over time (unveil the exact values by clicking on the image).
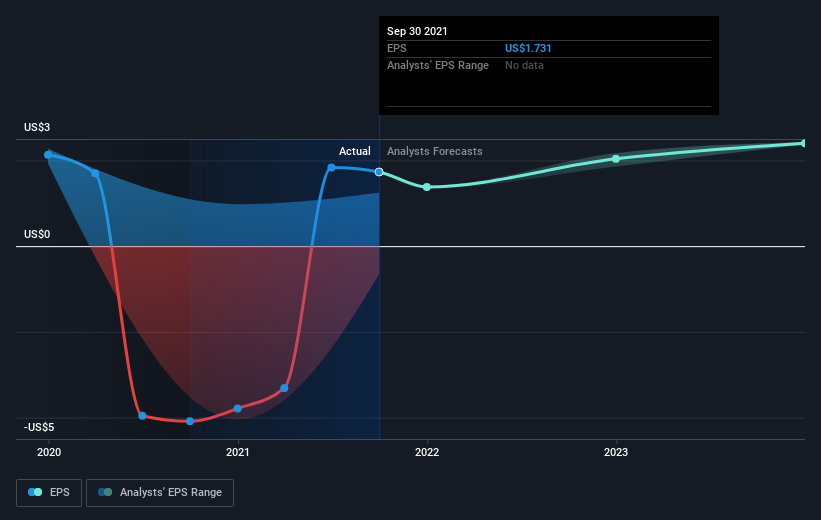
We know that Douglas Dynamics has improved its bottom line lately, but is it going to grow revenue? This free report showing analyst revenue forecasts should help you figure out if the EPS growth can be sustained.
What About Dividends?
When looking at investment returns, it is important to consider the difference between total shareholder return (TSR) and share price return. The TSR incorporates the value of any spin-offs or discounted capital raisings, along with any dividends, based on the assumption that the dividends are reinvested. It's fair to say that the TSR gives a more complete picture for stocks that pay a dividend. We note that for Douglas Dynamics the TSR over the last 1 year was -13%, which is better than the share price return mentioned above. The dividends paid by the company have thusly boosted the total shareholder return.
A Different Perspective
Douglas Dynamics shareholders are down 13% for the year (even including dividends), but the market itself is up 9.2%. Even the share prices of good stocks drop sometimes, but we want to see improvements in the fundamental metrics of a business, before getting too interested. On the bright side, long term shareholders have made money, with a gain of 3% per year over half a decade. If the fundamental data continues to indicate long term sustainable growth, the current sell-off could be an opportunity worth considering. I find it very interesting to look at share price over the long term as a proxy for business performance. But to truly gain insight, we need to consider other information, too. Case in point: We've spotted 3 warning signs for Douglas Dynamics you should be aware of.
If you like to buy stocks alongside management, then you might just love this free list of companies. (Hint: insiders have been buying them).
Please note, the market returns quoted in this article reflect the market weighted average returns of stocks that currently trade on US exchanges.
New: Manage All Your Stock Portfolios in One Place
We've created the ultimate portfolio companion for stock investors, and it's free.
• Connect an unlimited number of Portfolios and see your total in one currency
• Be alerted to new Warning Signs or Risks via email or mobile
• Track the Fair Value of your stocks
Have feedback on this article? Concerned about the content? Get in touch with us directly. Alternatively, email editorial-team (at) simplywallst.com.
This article by Simply Wall St is general in nature. We provide commentary based on historical data and analyst forecasts only using an unbiased methodology and our articles are not intended to be financial advice. It does not constitute a recommendation to buy or sell any stock, and does not take account of your objectives, or your financial situation. We aim to bring you long-term focused analysis driven by fundamental data. Note that our analysis may not factor in the latest price-sensitive company announcements or qualitative material. Simply Wall St has no position in any stocks mentioned.
About NYSE:PLOW
Douglas Dynamics
Operates as a manufacturer and upfitter of commercial work truck attachments and equipment in North America.
Solid track record with excellent balance sheet and pays a dividend.
Similar Companies
Market Insights

Advertisement
Community Narratives
Finding The True Value Of A Logistics Powerhouse
Fair Value US$95.21|8.4% undervalued
NV
Community Contributor
Paradigm Biopharmaceuticals Will Lead Osteoarthritis Treatment with Zilosul's FDA Success
Fair Value AU$5.50|91.9% undervalued
AM
Community Contributor
Barrick Mining (ABX:CA): A Gold Hedge against a U.S. Shutdown
Fair Value CA$60.00|24.2% undervalued
GM
Community Contributor