Advertisement
- United States
- /
- Banks
- /
- NasdaqGS:BANR
3 Dividend Stocks To Consider With Up To 3.6% Yield

Simply Wall St
Reviewed by Simply Wall St
As the U.S. stock market experiences a notable upswing, with major indices like the Dow Jones, S&P 500, and Nasdaq showing significant gains entering the Thanksgiving holiday, investors are increasingly eyeing opportunities for stable income amid this positive momentum. In such an environment, dividend stocks can offer a reliable source of income through regular payouts while potentially benefiting from capital appreciation as markets rise.
Top 10 Dividend Stocks In The United States
| Name | Dividend Yield | Dividend Rating |
| Provident Financial Services (PFS) | 4.94% | ★★★★★★ |
| Peoples Bancorp (PEBO) | 5.48% | ★★★★★★ |
| OTC Markets Group (OTCM) | 4.75% | ★★★★★★ |
| Interpublic Group of Companies (IPG) | 5.27% | ★★★★★★ |
| Heritage Commerce (HTBK) | 4.70% | ★★★★★★ |
| First Interstate BancSystem (FIBK) | 5.67% | ★★★★★★ |
| Farmers National Banc (FMNB) | 5.01% | ★★★★★★ |
| Ennis (EBF) | 5.76% | ★★★★★★ |
| Columbia Banking System (COLB) | 5.07% | ★★★★★★ |
| Citizens & Northern (CZNC) | 5.57% | ★★★★★★ |
Click here to see the full list of 120 stocks from our Top US Dividend Stocks screener.
Let's review some notable picks from our screened stocks.
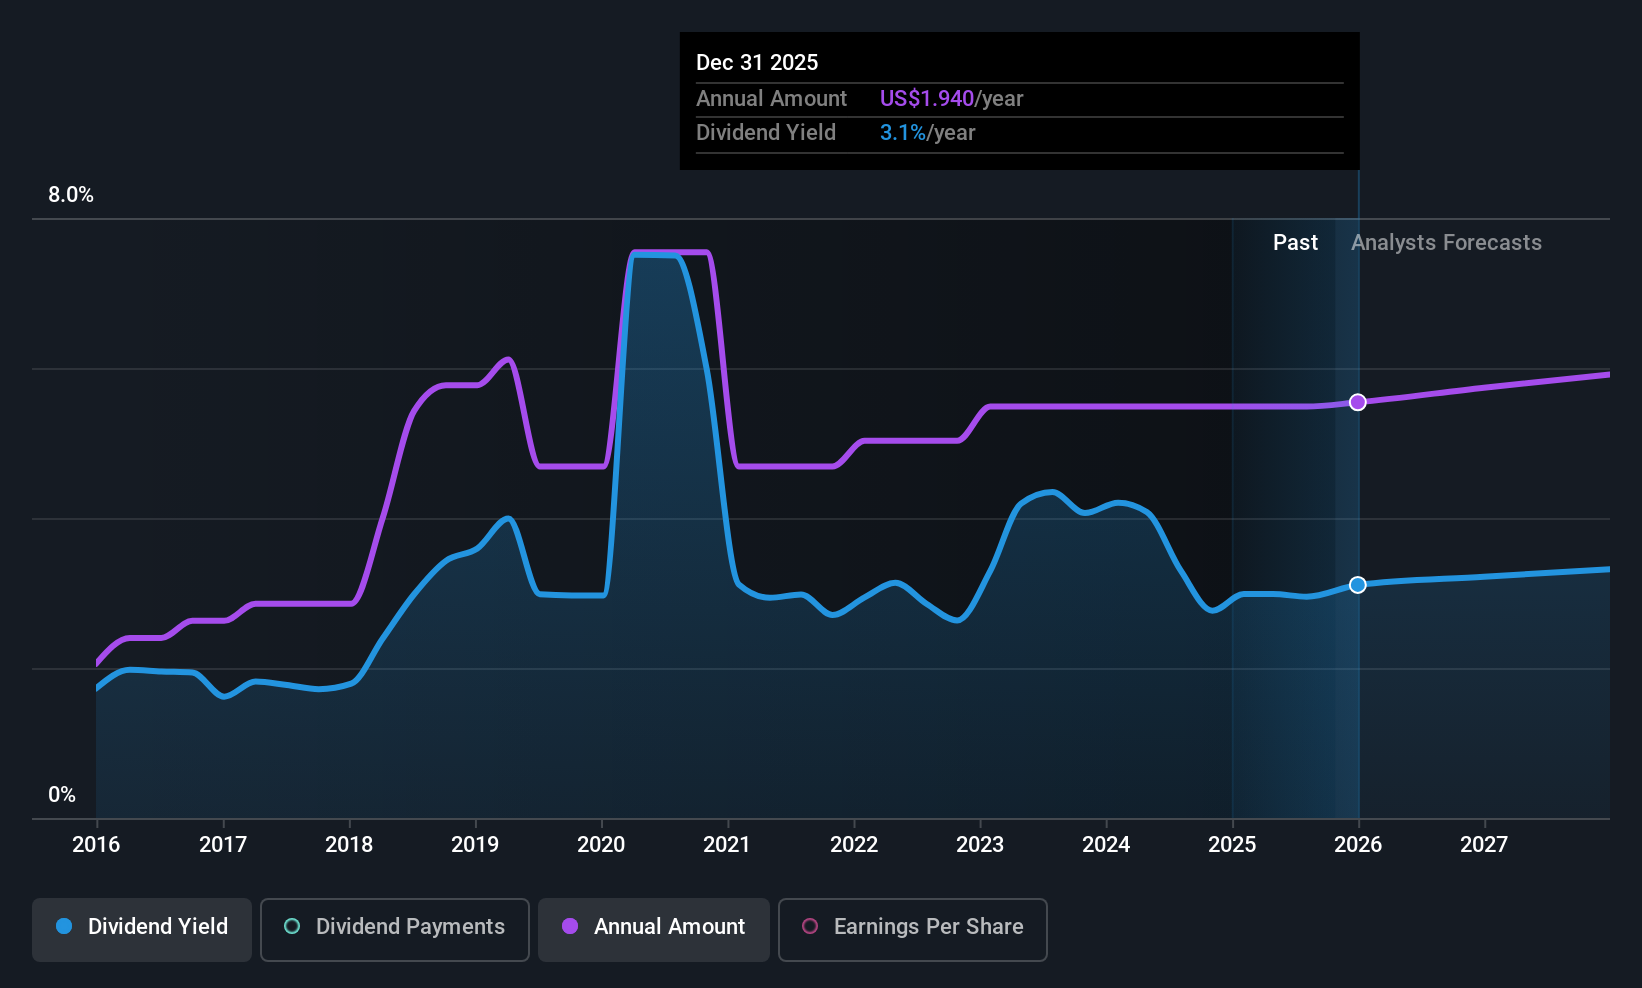
Banner (BANR)
Simply Wall St Dividend Rating: ★★★★☆☆
Overview: Banner Corporation is a bank holding company for Banner Bank, providing commercial banking and financial products and services to individuals, businesses, and public sector entities in the United States, with a market cap of approximately $2.13 billion.
Operations: Banner Corporation's revenue is primarily derived from its traditional banking operations, which involve gathering deposits and originating loans, amounting to $640.03 million.
Dividend Yield: 3.1%
Banner Corporation's dividend payments have grown over the past decade, though they have been volatile with significant annual drops. The current payout ratio of 34.8% suggests dividends are well covered by earnings, and this is expected to continue in three years at 33.1%. However, its dividend yield of 3.09% is lower than the top quartile in the US market. Recent financial results show strong earnings growth, supporting future dividend sustainability despite historical volatility concerns.
- Click to explore a detailed breakdown of our findings in Banner's dividend report.
- In light of our recent valuation report, it seems possible that Banner is trading behind its estimated value.
Weyco Group (WEYS)
Simply Wall St Dividend Rating: ★★★★★☆
Overview: Weyco Group, Inc. designs, markets, and distributes footwear for men, women, and children across various regions including the United States, Canada, Australia, Asia, and South Africa with a market cap of $284.30 million.
Operations: Weyco Group's revenue is primarily derived from its Wholesale segment, which accounts for $220.42 million, followed by the Retail segment at $36.45 million.
Dividend Yield: 3.6%
Weyco Group's dividends have steadily increased over the past decade, showing reliability with minimal volatility. The company's payout ratios, 41.7% for earnings and 31.5% for cash flows, indicate sustainable dividend coverage. Although its yield of 3.58% is below the top US dividend payers, Weyco declared a special $2 per share dividend alongside its regular $0.27 per share payout, reflecting strong financial management despite recent earnings declines and strategic debt restructuring efforts.
- Click here and access our complete dividend analysis report to understand the dynamics of Weyco Group.
- Our expertly prepared valuation report Weyco Group implies its share price may be lower than expected.

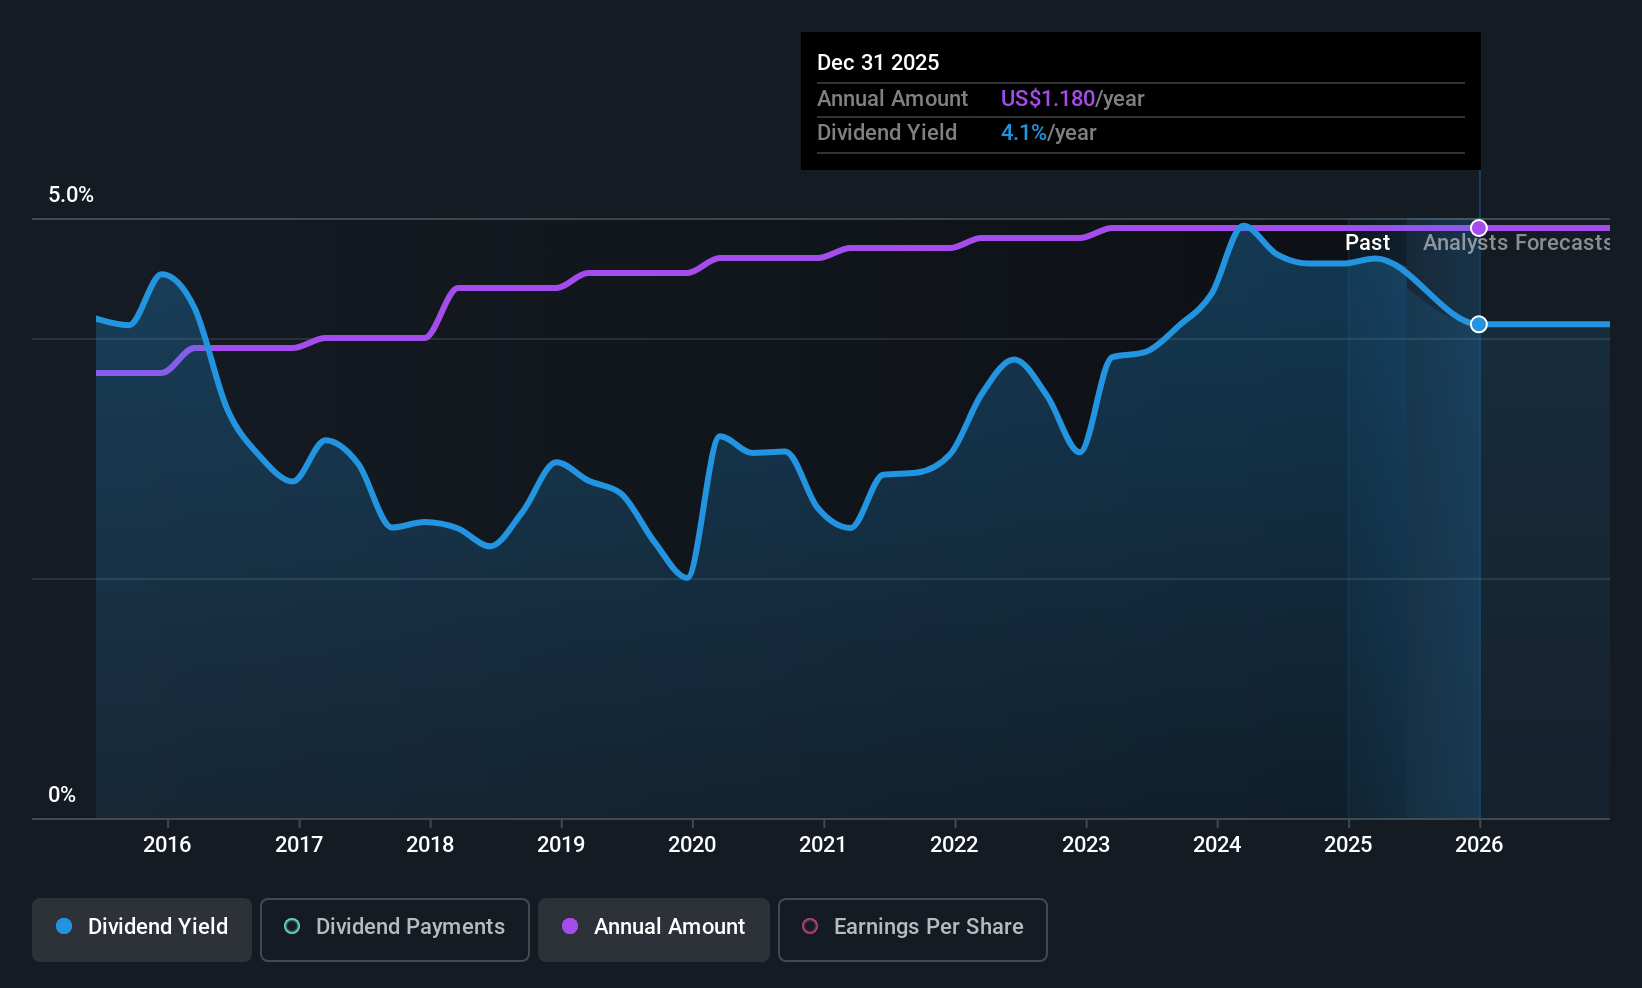
Douglas Dynamics (PLOW)
Simply Wall St Dividend Rating: ★★★★★☆
Overview: Douglas Dynamics, Inc. is a North American manufacturer and upfitter of commercial work truck attachments and equipment with a market cap of $732.01 million.
Operations: Douglas Dynamics, Inc. generates revenue through its Work Truck Solutions segment, which accounts for $348.61 million, and its Work Truck Attachments segment, contributing $266.45 million.
Dividend Yield: 3.6%
Douglas Dynamics maintains stable dividend payments, supported by a 66.2% payout ratio and a reliable cash flow coverage of 65.9%. Despite a lower profit margin compared to last year, the company continues its decade-long trend of consistent dividend growth. The recent filing for shelf registration suggests potential capital raising, while updated earnings guidance indicates improved sales expectations for 2025 between US$635 million and US$660 million. However, its yield remains below top-tier US dividends at 3.63%.
- Delve into the full analysis dividend report here for a deeper understanding of Douglas Dynamics.
- Insights from our recent valuation report point to the potential undervaluation of Douglas Dynamics shares in the market.
Turning Ideas Into Actions
- Investigate our full lineup of 120 Top US Dividend Stocks right here.
- Already own these companies? Link your portfolio to Simply Wall St and get alerts on any new warning signs to your stocks.
- Discover a world of investment opportunities with Simply Wall St's free app and access unparalleled stock analysis across all markets.
Curious About Other Options?
- Explore high-performing small cap companies that haven't yet garnered significant analyst attention.
- Fuel your portfolio with companies showing strong growth potential, backed by optimistic outlooks both from analysts and management.
- Find companies with promising cash flow potential yet trading below their fair value.
This article by Simply Wall St is general in nature. We provide commentary based on historical data and analyst forecasts only using an unbiased methodology and our articles are not intended to be financial advice. It does not constitute a recommendation to buy or sell any stock, and does not take account of your objectives, or your financial situation. We aim to bring you long-term focused analysis driven by fundamental data. Note that our analysis may not factor in the latest price-sensitive company announcements or qualitative material. Simply Wall St has no position in any stocks mentioned.
Valuation is complex, but we're here to simplify it.
Discover if Banner might be undervalued or overvalued with our detailed analysis, featuring fair value estimates, potential risks, dividends, insider trades, and its financial condition.
Access Free AnalysisHave feedback on this article? Concerned about the content? Get in touch with us directly. Alternatively, email editorial-team@simplywallst.com
About NasdaqGS:BANR
Banner
Operates as the bank holding company for Banner Bank that engages in the provision of commercial banking and financial products and services to individuals, businesses, and public sector entities in the United States.
Flawless balance sheet with proven track record and pays a dividend.
Similar Companies
Market Insights

Advertisement
Community Narratives
MicroVision will explode future revenue by 380.37% with a vision towards success
Fair Value US$60|98.4% undervalued
TH
Community Contributor
The Indispensable Artery for a New North American Economy
Fair Value CA$132.87|1.6% undervalued
TI
Community Contributor
Recently Updated Narratives
BE


Bejgal on MINISO Group Holding ·
MINISO's fair value is projected at 26.69 with an anticipated PE ratio shift of 20x
Fair Value:US$26.6928.0% undervalued
44 followersusers have followed this narrative
3 commentsusers have commented on this narrative
0 likesusers have liked this narrative
TI


TickerTickle on Oracle ·
The Quiet Giant That Became AI’s Power Grid
Fair Value:US$389.8149.5% undervalued
7 followersusers have followed this narrative
1 commentusers have commented on this narrative
0 likesusers have liked this narrative
AU

AuCA on Nova Ljubljanska Banka d.d ·
Nova Ljubljanska Banka d.d will expect a 11.2% revenue boost driving future growth
Fair Value:€20916.5% undervalued
23 followersusers have followed this narrative
3 commentsusers have commented on this narrative
0 likesusers have liked this narrative
Popular Narratives
OS


oscargarcia on Alphabet ·
The company that turned a verb into a global necessity and basically runs the modern internet, digital ads, smartphones, maps, and AI.
Fair Value:US$3404.9% undervalued
136 followersusers have followed this narrative
6 commentsusers have commented on this narrative
18 likesusers have liked this narrative
TH

TheWallstreetKing on MicroVision ·
MicroVision will explode future revenue by 380.37% with a vision towards success
Fair Value:US$6098.4% undervalued
87 followersusers have followed this narrative
11 commentsusers have commented on this narrative
18 likesusers have liked this narrative
AN


AnalystConsensusTarget on NVIDIA ·
NVDA: Expanding AI Demand Will Drive Major Data Center Investments Through 2026
Fair Value:US$232.7923.6% undervalued
925 followersusers have followed this narrative
6 commentsusers have commented on this narrative
22 likesusers have liked this narrative