
Advertisement
- United States
- /
- Industrials
- /
- NYSE:MMM
3M (NYSE:MMM) shareholder returns have been respectable, earning 65% in 1 year
The simplest way to invest in stocks is to buy exchange traded funds. But if you pick the right individual stocks, you could make more than that. To wit, the 3M Company (NYSE:MMM) share price is 32% higher than it was a year ago, much better than the market return of around 24% (not including dividends) in the same period. So that should have shareholders smiling. Unfortunately the longer term returns are not so good, with the stock falling 27% in the last three years.
Since the stock has added US$2.5b to its market cap in the past week alone, let's see if underlying performance has been driving long-term returns.
View our latest analysis for 3M
There is no denying that markets are sometimes efficient, but prices do not always reflect underlying business performance. By comparing earnings per share (EPS) and share price changes over time, we can get a feel for how investor attitudes to a company have morphed over time.
During the last year 3M grew its earnings per share, moving from a loss to a profit.
When a company has just transitioned to profitability, earnings per share growth is not always the best way to look at the share price action.
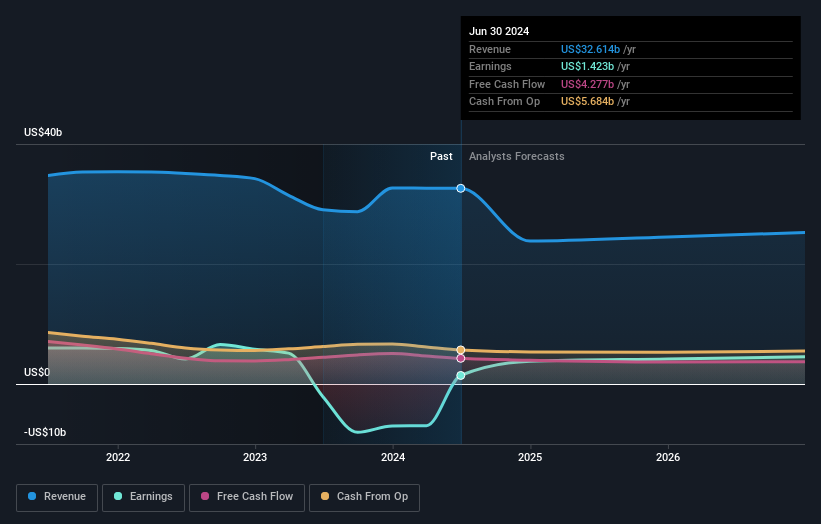
However the year on year revenue growth of 12% would help. Many businesses do go through a phase where they have to forgo some profits to drive business development, and sometimes its for the best.
The company's revenue and earnings (over time) are depicted in the image below (click to see the exact numbers).
3M is a well known stock, with plenty of analyst coverage, suggesting some visibility into future growth. If you are thinking of buying or selling 3M stock, you should check out this free report showing analyst consensus estimates for future profits.
What About Dividends?
As well as measuring the share price return, investors should also consider the total shareholder return (TSR). The TSR is a return calculation that accounts for the value of cash dividends (assuming that any dividend received was reinvested) and the calculated value of any discounted capital raisings and spin-offs. So for companies that pay a generous dividend, the TSR is often a lot higher than the share price return. As it happens, 3M's TSR for the last 1 year was 65%, which exceeds the share price return mentioned earlier. The dividends paid by the company have thusly boosted the total shareholder return.
A Different Perspective
It's good to see that 3M has rewarded shareholders with a total shareholder return of 65% in the last twelve months. That's including the dividend. That gain is better than the annual TSR over five years, which is 3%. Therefore it seems like sentiment around the company has been positive lately. Someone with an optimistic perspective could view the recent improvement in TSR as indicating that the business itself is getting better with time. It's always interesting to track share price performance over the longer term. But to understand 3M better, we need to consider many other factors. Case in point: We've spotted 3 warning signs for 3M you should be aware of.
If you like to buy stocks alongside management, then you might just love this free list of companies. (Hint: many of them are unnoticed AND have attractive valuation).
Please note, the market returns quoted in this article reflect the market weighted average returns of stocks that currently trade on American exchanges.
Valuation is complex, but we're here to simplify it.
Discover if 3M might be undervalued or overvalued with our detailed analysis, featuring fair value estimates, potential risks, dividends, insider trades, and its financial condition.
Access Free AnalysisHave feedback on this article? Concerned about the content? Get in touch with us directly. Alternatively, email editorial-team (at) simplywallst.com.
This article by Simply Wall St is general in nature. We provide commentary based on historical data and analyst forecasts only using an unbiased methodology and our articles are not intended to be financial advice. It does not constitute a recommendation to buy or sell any stock, and does not take account of your objectives, or your financial situation. We aim to bring you long-term focused analysis driven by fundamental data. Note that our analysis may not factor in the latest price-sensitive company announcements or qualitative material. Simply Wall St has no position in any stocks mentioned.
About NYSE:MMM
3M
Provides diversified technology services in the Americas, the Asia Pacific, Europe, the Middle East, Africa, and internationally.
Fair value low.
Similar Companies
Market Insights

Advertisement
Community Narratives
Pinterest will surge as advertising innovations ignite revenue growth
Fair Value US$42.63|27.1% undervalued
BR
Community Contributor
Brambles' Revenue Set to Climb 14% with Profit Margins Following
Fair Value AU$21.90|5.9% overvalued
RO
Community Contributor
Challenging Future for STG as Organic Sales Decline by 8.8%
Fair Value DKK 116.13|26.8% undervalued
KA
Community Contributor