- United States
- /
- Aerospace & Defense
- /
- NYSE:KAMN
There's Reason For Concern Over Kaman Corporation's (NYSE:KAMN) Massive 88% Price Jump


Despite an already strong run, Kaman Corporation (NYSE:KAMN) shares have been powering on, with a gain of 88% in the last thirty days. Looking back a bit further, it's encouraging to see the stock is up 95% in the last year.
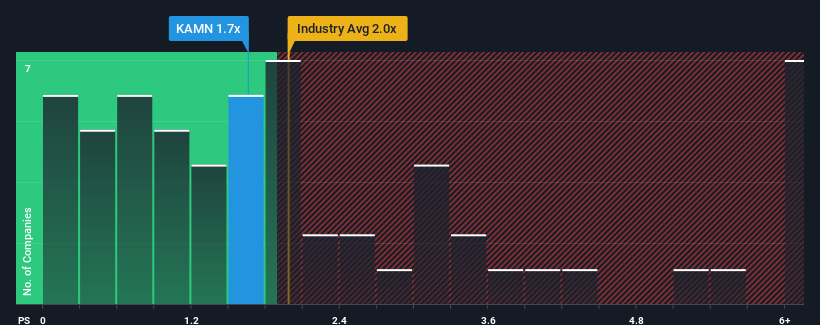
Although its price has surged higher, you could still be forgiven for feeling indifferent about Kaman's P/S ratio of 1.7x, since the median price-to-sales (or "P/S") ratio for the Aerospace & Defense industry in the United States is also close to 2x. Although, it's not wise to simply ignore the P/S without explanation as investors may be disregarding a distinct opportunity or a costly mistake.
View our latest analysis for Kaman
What Does Kaman's Recent Performance Look Like?
With revenue growth that's superior to most other companies of late, Kaman has been doing relatively well. One possibility is that the P/S ratio is moderate because investors think this strong revenue performance might be about to tail off. If you like the company, you'd be hoping this isn't the case so that you could potentially pick up some stock while it's not quite in favour.
Want the full picture on analyst estimates for the company? Then our free report on Kaman will help you uncover what's on the horizon.How Is Kaman's Revenue Growth Trending?
There's an inherent assumption that a company should be matching the industry for P/S ratios like Kaman's to be considered reasonable.
If we review the last year of revenue growth, the company posted a terrific increase of 16%. Despite this strong recent growth, it's still struggling to catch up as its three-year revenue frustratingly shrank by 8.0% overall. Therefore, it's fair to say the revenue growth recently has been undesirable for the company.
Turning to the outlook, the next year should generate growth of 2.1% as estimated by the two analysts watching the company. Meanwhile, the rest of the industry is forecast to expand by 10%, which is noticeably more attractive.
In light of this, it's curious that Kaman's P/S sits in line with the majority of other companies. It seems most investors are ignoring the fairly limited growth expectations and are willing to pay up for exposure to the stock. These shareholders may be setting themselves up for future disappointment if the P/S falls to levels more in line with the growth outlook.
The Final Word
Kaman's stock has a lot of momentum behind it lately, which has brought its P/S level with the rest of the industry. Typically, we'd caution against reading too much into price-to-sales ratios when settling on investment decisions, though it can reveal plenty about what other market participants think about the company.
Given that Kaman's revenue growth projections are relatively subdued in comparison to the wider industry, it comes as a surprise to see it trading at its current P/S ratio. At present, we aren't confident in the P/S as the predicted future revenues aren't likely to support a more positive sentiment for long. This places shareholders' investments at risk and potential investors in danger of paying an unnecessary premium.
We don't want to rain on the parade too much, but we did also find 3 warning signs for Kaman (2 can't be ignored!) that you need to be mindful of.
Of course, profitable companies with a history of great earnings growth are generally safer bets. So you may wish to see this free collection of other companies that have reasonable P/E ratios and have grown earnings strongly.
If you're looking to trade Kaman, open an account with the lowest-cost platform trusted by professionals, Interactive Brokers.
With clients in over 200 countries and territories, and access to 160 markets, IBKR lets you trade stocks, options, futures, forex, bonds and funds from a single integrated account.
Enjoy no hidden fees, no account minimums, and FX conversion rates as low as 0.03%, far better than what most brokers offer.
Sponsored ContentValuation is complex, but we're here to simplify it.
Discover if Kaman might be undervalued or overvalued with our detailed analysis, featuring fair value estimates, potential risks, dividends, insider trades, and its financial condition.
Access Free AnalysisHave feedback on this article? Concerned about the content? Get in touch with us directly. Alternatively, email editorial-team (at) simplywallst.com.
This article by Simply Wall St is general in nature. We provide commentary based on historical data and analyst forecasts only using an unbiased methodology and our articles are not intended to be financial advice. It does not constitute a recommendation to buy or sell any stock, and does not take account of your objectives, or your financial situation. We aim to bring you long-term focused analysis driven by fundamental data. Note that our analysis may not factor in the latest price-sensitive company announcements or qualitative material. Simply Wall St has no position in any stocks mentioned.
About NYSE:KAMN
Kaman
Kaman Corporation, together with its subsidiaries, operates in the aerospace, defense, medical, and industrial markets.
Average dividend payer and fair value.
Similar Companies
Market Insights

Community Narratives

