Is Jacobs Engineering Group Inc.'s (NYSE:JEC) Capital Allocation Ability Worth Your Time?


Want to participate in a short research study? Help shape the future of investing tools and you could win a $250 gift card!
Today we are going to look at Jacobs Engineering Group Inc. (NYSE:JEC) to see whether it might be an attractive investment prospect. Specifically, we're going to calculate its Return On Capital Employed (ROCE), in the hopes of getting some insight into the business.
Firstly, we'll go over how we calculate ROCE. Next, we'll compare it to others in its industry. Last but not least, we'll look at what impact its current liabilities have on its ROCE.
What is Return On Capital Employed (ROCE)?
ROCE measures the amount of pre-tax profits a company can generate from the capital employed in its business. In general, businesses with a higher ROCE are usually better quality. Ultimately, it is a useful but imperfect metric. Author Edwin Whiting says to be careful when comparing the ROCE of different businesses, since 'No two businesses are exactly alike.'
How Do You Calculate Return On Capital Employed?
Analysts use this formula to calculate return on capital employed:
Return on Capital Employed = Earnings Before Interest and Tax (EBIT) ÷ (Total Assets - Current Liabilities)
Or for Jacobs Engineering Group:
0.086 = US$843m ÷ (US$13b - US$3.2b) (Based on the trailing twelve months to March 2019.)
So, Jacobs Engineering Group has an ROCE of 8.6%.
View our latest analysis for Jacobs Engineering Group
Does Jacobs Engineering Group Have A Good ROCE?
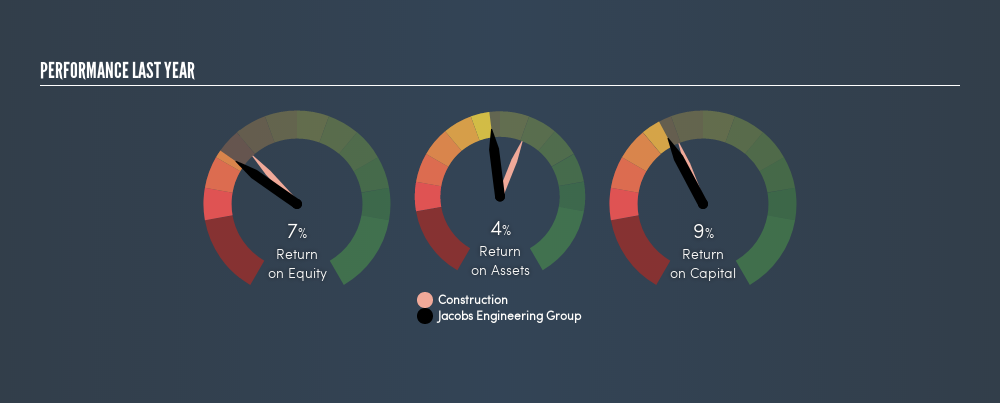
When making comparisons between similar businesses, investors may find ROCE useful. Using our data, Jacobs Engineering Group's ROCE appears to be around the 9.2% average of the Construction industry. Setting aside the industry comparison for now, Jacobs Engineering Group's ROCE is mediocre in absolute terms, considering the risk of investing in stocks versus the safety of a bank account. It is possible that there are more rewarding investments out there.
Remember that this metric is backwards looking - it shows what has happened in the past, and does not accurately predict the future. ROCE can be deceptive for cyclical businesses, as returns can look incredible in boom times, and terribly low in downturns. ROCE is only a point-in-time measure. Future performance is what matters, and you can see analyst predictions in our free report on analyst forecasts for the company.
Do Jacobs Engineering Group's Current Liabilities Skew Its ROCE?
Current liabilities include invoices, such as supplier payments, short-term debt, or a tax bill, that need to be paid within 12 months. The ROCE equation subtracts current liabilities from capital employed, so a company with a lot of current liabilities appears to have less capital employed, and a higher ROCE than otherwise. To counter this, investors can check if a company has high current liabilities relative to total assets.
Jacobs Engineering Group has total liabilities of US$3.2b and total assets of US$13b. Therefore its current liabilities are equivalent to approximately 25% of its total assets. This very reasonable level of current liabilities would not boost the ROCE by much.
What We Can Learn From Jacobs Engineering Group's ROCE
With that in mind, we're not overly impressed with Jacobs Engineering Group's ROCE, so it may not be the most appealing prospect. But note: make sure you look for a great company, not just the first idea you come across. So take a peek at this free list of interesting companies with strong recent earnings growth (and a P/E ratio below 20).
If you are like me, then you will not want to miss this free list of growing companies that insiders are buying.
We aim to bring you long-term focused research analysis driven by fundamental data. Note that our analysis may not factor in the latest price-sensitive company announcements or qualitative material.
If you spot an error that warrants correction, please contact the editor at editorial-team@simplywallst.com. This article by Simply Wall St is general in nature. It does not constitute a recommendation to buy or sell any stock, and does not take account of your objectives, or your financial situation. Simply Wall St has no position in the stocks mentioned. Thank you for reading.
About NYSE:J
Jacobs Solutions
Engages in the infrastructure and advanced facilities, and consulting businesses in the United States, Europe, Canada, India, Asia, Australia, New Zealand, the Middle East, and Africa.
Excellent balance sheet with reasonable growth potential.
Similar Companies
Market Insights

Community Narratives

