- United States
- /
- Machinery
- /
- NYSE:GTLS
Investors Aren't Entirely Convinced By Chart Industries, Inc.'s (NYSE:GTLS) Revenues


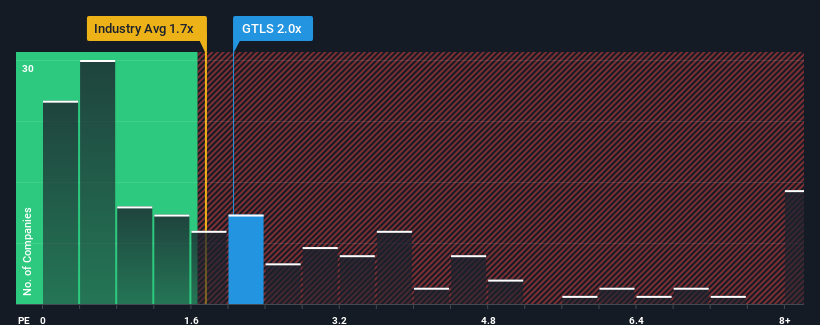
It's not a stretch to say that Chart Industries, Inc.'s (NYSE:GTLS) price-to-sales (or "P/S") ratio of 2x right now seems quite "middle-of-the-road" for companies in the Machinery industry in the United States, where the median P/S ratio is around 1.7x. However, investors might be overlooking a clear opportunity or potential setback if there is no rational basis for the P/S.
Check out our latest analysis for Chart Industries
How Chart Industries Has Been Performing
Chart Industries certainly has been doing a good job lately as its revenue growth has been positive while most other companies have been seeing their revenue go backwards. It might be that many expect the strong revenue performance to deteriorate like the rest, which has kept the P/S ratio from rising. Those who are bullish on Chart Industries will be hoping that this isn't the case, so that they can pick up the stock at a slightly lower valuation.
Keen to find out how analysts think Chart Industries' future stacks up against the industry? In that case, our free report is a great place to start.What Are Revenue Growth Metrics Telling Us About The P/S?
The only time you'd be comfortable seeing a P/S like Chart Industries' is when the company's growth is tracking the industry closely.
Retrospectively, the last year delivered an exceptional 46% gain to the company's top line. The strong recent performance means it was also able to grow revenue by 225% in total over the last three years. Accordingly, shareholders would have definitely welcomed those medium-term rates of revenue growth.
Turning to the outlook, the next three years should generate growth of 9.6% per year as estimated by the analysts watching the company. Meanwhile, the rest of the industry is forecast to only expand by 3.5% each year, which is noticeably less attractive.
With this in consideration, we find it intriguing that Chart Industries' P/S is closely matching its industry peers. Apparently some shareholders are skeptical of the forecasts and have been accepting lower selling prices.
What Does Chart Industries' P/S Mean For Investors?
We'd say the price-to-sales ratio's power isn't primarily as a valuation instrument but rather to gauge current investor sentiment and future expectations.
We've established that Chart Industries currently trades on a lower than expected P/S since its forecasted revenue growth is higher than the wider industry. Perhaps uncertainty in the revenue forecasts are what's keeping the P/S ratio consistent with the rest of the industry. However, if you agree with the analysts' forecasts, you may be able to pick up the stock at an attractive price.
Plus, you should also learn about this 1 warning sign we've spotted with Chart Industries.
If companies with solid past earnings growth is up your alley, you may wish to see this free collection of other companies with strong earnings growth and low P/E ratios.
If you're looking to trade Chart Industries, open an account with the lowest-cost platform trusted by professionals, Interactive Brokers.
With clients in over 200 countries and territories, and access to 160 markets, IBKR lets you trade stocks, options, futures, forex, bonds and funds from a single integrated account.
Enjoy no hidden fees, no account minimums, and FX conversion rates as low as 0.03%, far better than what most brokers offer.
Sponsored ContentNew: AI Stock Screener & Alerts
Our new AI Stock Screener scans the market every day to uncover opportunities.
• Dividend Powerhouses (3%+ Yield)
• Undervalued Small Caps with Insider Buying
• High growth Tech and AI Companies
Or build your own from over 50 metrics.
Have feedback on this article? Concerned about the content? Get in touch with us directly. Alternatively, email editorial-team (at) simplywallst.com.
This article by Simply Wall St is general in nature. We provide commentary based on historical data and analyst forecasts only using an unbiased methodology and our articles are not intended to be financial advice. It does not constitute a recommendation to buy or sell any stock, and does not take account of your objectives, or your financial situation. We aim to bring you long-term focused analysis driven by fundamental data. Note that our analysis may not factor in the latest price-sensitive company announcements or qualitative material. Simply Wall St has no position in any stocks mentioned.
About NYSE:GTLS
Chart Industries
Engages in the designing, engineering, and manufacturing of process technologies and equipment for the gas and liquid molecules in the United States and internationally.
Solid track record and good value.
Similar Companies
Market Insights

Community Narratives

