- United States
- /
- Machinery
- /
- NYSE:GTLS
Chart Industries (NYSE:GTLS) Takes On Some Risk With Its Use Of Debt


Legendary fund manager Li Lu (who Charlie Munger backed) once said, 'The biggest investment risk is not the volatility of prices, but whether you will suffer a permanent loss of capital.' It's only natural to consider a company's balance sheet when you examine how risky it is, since debt is often involved when a business collapses. Importantly, Chart Industries, Inc. (NYSE:GTLS) does carry debt. But should shareholders be worried about its use of debt?
Why Does Debt Bring Risk?
Generally speaking, debt only becomes a real problem when a company can't easily pay it off, either by raising capital or with its own cash flow. Part and parcel of capitalism is the process of 'creative destruction' where failed businesses are mercilessly liquidated by their bankers. However, a more frequent (but still costly) occurrence is where a company must issue shares at bargain-basement prices, permanently diluting shareholders, just to shore up its balance sheet. By replacing dilution, though, debt can be an extremely good tool for businesses that need capital to invest in growth at high rates of return. The first thing to do when considering how much debt a business uses is to look at its cash and debt together.
Check out our latest analysis for Chart Industries
How Much Debt Does Chart Industries Carry?
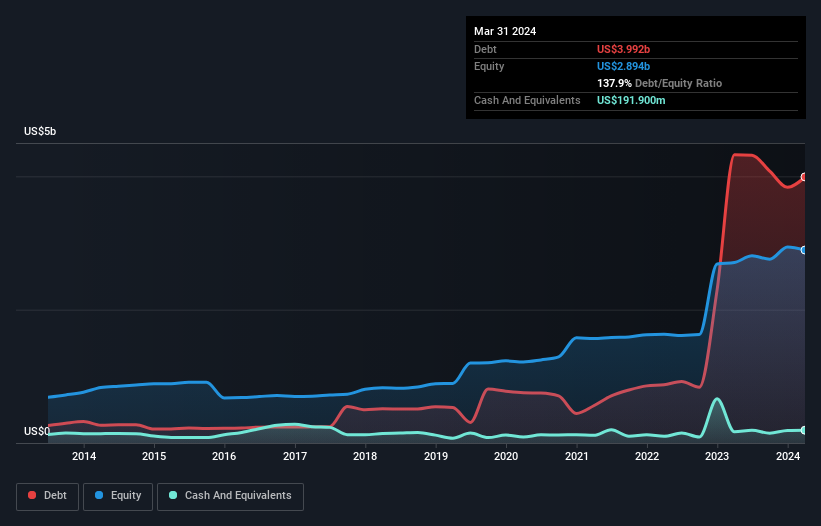
The image below, which you can click on for greater detail, shows that Chart Industries had debt of US$3.99b at the end of March 2024, a reduction from US$4.33b over a year. However, because it has a cash reserve of US$191.9m, its net debt is less, at about US$3.80b.
How Healthy Is Chart Industries' Balance Sheet?
The latest balance sheet data shows that Chart Industries had liabilities of US$1.89b due within a year, and liabilities of US$4.46b falling due after that. Offsetting this, it had US$191.9m in cash and US$1.38b in receivables that were due within 12 months. So its liabilities outweigh the sum of its cash and (near-term) receivables by US$4.79b.
This is a mountain of leverage relative to its market capitalization of US$6.52b. Should its lenders demand that it shore up the balance sheet, shareholders would likely face severe dilution.
We measure a company's debt load relative to its earnings power by looking at its net debt divided by its earnings before interest, tax, depreciation, and amortization (EBITDA) and by calculating how easily its earnings before interest and tax (EBIT) cover its interest expense (interest cover). The advantage of this approach is that we take into account both the absolute quantum of debt (with net debt to EBITDA) and the actual interest expenses associated with that debt (with its interest cover ratio).
While Chart Industries's debt to EBITDA ratio (4.8) suggests that it uses some debt, its interest cover is very weak, at 1.6, suggesting high leverage. So shareholders should probably be aware that interest expenses appear to have really impacted the business lately. The silver lining is that Chart Industries grew its EBIT by 189% last year, which nourishing like the idealism of youth. If it can keep walking that path it will be in a position to shed its debt with relative ease. There's no doubt that we learn most about debt from the balance sheet. But ultimately the future profitability of the business will decide if Chart Industries can strengthen its balance sheet over time. So if you want to see what the professionals think, you might find this free report on analyst profit forecasts to be interesting.
Finally, while the tax-man may adore accounting profits, lenders only accept cold hard cash. So it's worth checking how much of that EBIT is backed by free cash flow. Over the last three years, Chart Industries saw substantial negative free cash flow, in total. While investors are no doubt expecting a reversal of that situation in due course, it clearly does mean its use of debt is more risky.
Our View
On the face of it, Chart Industries's interest cover left us tentative about the stock, and its conversion of EBIT to free cash flow was no more enticing than the one empty restaurant on the busiest night of the year. But at least it's pretty decent at growing its EBIT; that's encouraging. Looking at the balance sheet and taking into account all these factors, we do believe that debt is making Chart Industries stock a bit risky. Some people like that sort of risk, but we're mindful of the potential pitfalls, so we'd probably prefer it carry less debt. There's no doubt that we learn most about debt from the balance sheet. But ultimately, every company can contain risks that exist outside of the balance sheet. For example, we've discovered 3 warning signs for Chart Industries (1 doesn't sit too well with us!) that you should be aware of before investing here.
If you're interested in investing in businesses that can grow profits without the burden of debt, then check out this free list of growing businesses that have net cash on the balance sheet.
New: AI Stock Screener & Alerts
Our new AI Stock Screener scans the market every day to uncover opportunities.
• Dividend Powerhouses (3%+ Yield)
• Undervalued Small Caps with Insider Buying
• High growth Tech and AI Companies
Or build your own from over 50 metrics.
Have feedback on this article? Concerned about the content? Get in touch with us directly. Alternatively, email editorial-team (at) simplywallst.com.
This article by Simply Wall St is general in nature. We provide commentary based on historical data and analyst forecasts only using an unbiased methodology and our articles are not intended to be financial advice. It does not constitute a recommendation to buy or sell any stock, and does not take account of your objectives, or your financial situation. We aim to bring you long-term focused analysis driven by fundamental data. Note that our analysis may not factor in the latest price-sensitive company announcements or qualitative material. Simply Wall St has no position in any stocks mentioned.
About NYSE:GTLS
Chart Industries
Engages in the designing, engineering, and manufacturing of process technologies and equipment for the gas and liquid molecules in the United States and internationally.
Moderate growth potential with acceptable track record.
Similar Companies
Market Insights

Community Narratives


