Chart Industries (GTLS) shares have been drawing attention recently, with investors taking note of the company’s strong performance over the past year. Chart has delivered a 22% return in the past 12 months, sparking discussions about its future prospects.
Chart Industries’ solid 22% total shareholder return over the past year points to building momentum, capping off steady gains and a share price now sitting at $203.54. While the company hasn’t announced any major news recently, investors seem to be recognizing both its long-term growth story and improving fundamentals.
If you’re interested in finding other companies with this kind of upward momentum, now is a perfect time to broaden your search and discover fast growing stocks with high insider ownership
With Chart’s strong returns and a share price near its analyst target, the key question is whether the recent gains reflect its full growth potential or if there is still value left for new investors to capture.
Advertisement
Most Popular Narrative: 1.5% Undervalued
Chart Industries closed at $203.54, which is slightly below the most popular fair value estimate of $206.67. This narrow gap reflects a market largely in agreement with the narrative’s assumptions, raising the stakes for whether recent momentum has more to run.
Chart Industries is experiencing a significant increase in order volume, including a 17.3% increase from the first quarter of 2024 to the first quarter of 2025, which could enhance future revenue as these orders are fulfilled. The integration of Howden has resulted in cost synergies, contributing to an expansion in adjusted operating income margin by 190 basis points. This is expected to bolster future net margins.
Curious what’s fueling this valuation? The narrative hinges on bold growth targets and a financial turnaround many won’t see coming. Uncover the quantitative drivers and surprises baked into the consensus fair value. These projections might just shift your perspective on what’s possible for Chart Industries.
However, persistent geopolitical tensions and uncertainties around large project execution could quickly shift the outlook and present challenges to current growth expectations for Chart Industries.
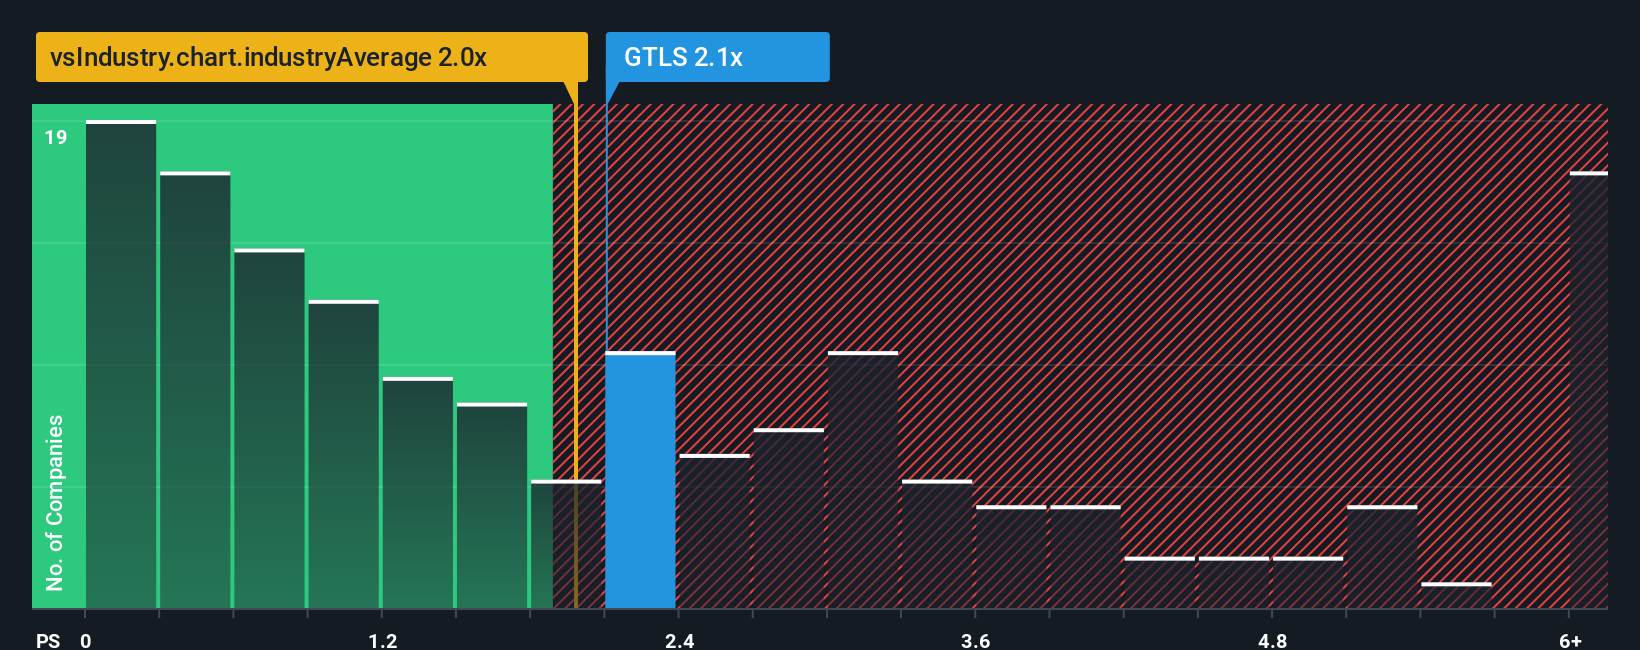
Looking at Chart Industries from a price-to-sales lens adds a different perspective. The company's ratio sits at 2.1x, just above the US Machinery industry average of 1.9x, but well below peers averaging 3.1x and under its own fair ratio of 2.6x. This positions Chart closer to the middle, suggesting less valuation risk than some rivals but not a glaring bargain either. Does this moderate gap mean the market is playing it safe or missing out on latent upside?
If you have a different angle or enjoy crunching the numbers yourself, you can shape your own narrative in minutes: Do it your way
A great starting point for your Chart Industries research is our analysis highlighting 2 key rewards and 3 important warning signs that could impact your investment decision.
Ready for More Winning Ideas?
Why limit yourself to just one stock when today’s markets offer incredible opportunities? See what else stands out with these hand-picked, forward-looking screeners.
Capitalize on massive future potential by spotting the next wave of innovation among these 26 AI penny stocks that are poised to reshape industries and technology as we know it.
Lock in high-yield opportunities with steady cash flow by checking out these 18 dividend stocks with yields > 3%, designed for income-focused investors who are not willing to settle for less.
Ride the cutting edge of finance by tracking the momentum and growth behind these 82 cryptocurrency and blockchain stocks, which is redefining payments, blockchain, and how value moves worldwide.
This article by Simply Wall St is general in nature. We provide commentary based on historical data
and analyst forecasts only using an unbiased methodology and our articles are not intended to be financial advice. It does not constitute a recommendation to buy or sell any stock, and does not take account of your objectives, or your
financial situation. We aim to bring you long-term focused analysis driven by fundamental data.
Note that our analysis may not factor in the latest price-sensitive company announcements or qualitative material.
Simply Wall St has no position in any stocks mentioned.
New: AI Stock Screener & Alerts
Our new AI Stock Screener scans the market every day to uncover opportunities.
• Dividend Powerhouses (3%+ Yield) • Undervalued Small Caps with Insider Buying • High growth Tech and AI Companies
Engages in the designing, engineering, and manufacturing of process technologies and equipment for the gas and liquid molecules in the United States and internationally.