- United States
- /
- Machinery
- /
- NYSE:GBX
Greenbrier Companies' (NYSE:GBX) underlying earnings growth outpaced the respectable return generated for shareholders over the past year


These days it's easy to simply buy an index fund, and your returns should (roughly) match the market. But one can do better than that by picking better than average stocks (as part of a diversified portfolio). To wit, the The Greenbrier Companies, Inc. (NYSE:GBX) share price is 83% higher than it was a year ago, much better than the market return of around 26% (not including dividends) in the same period. So that should have shareholders smiling. However, the stock hasn't done so well in the longer term, with the stock only up 7.4% in three years.
While the stock has fallen 4.1% this week, it's worth focusing on the longer term and seeing if the stocks historical returns have been driven by the underlying fundamentals.
View our latest analysis for Greenbrier Companies
While markets are a powerful pricing mechanism, share prices reflect investor sentiment, not just underlying business performance. One imperfect but simple way to consider how the market perception of a company has shifted is to compare the change in the earnings per share (EPS) with the share price movement.
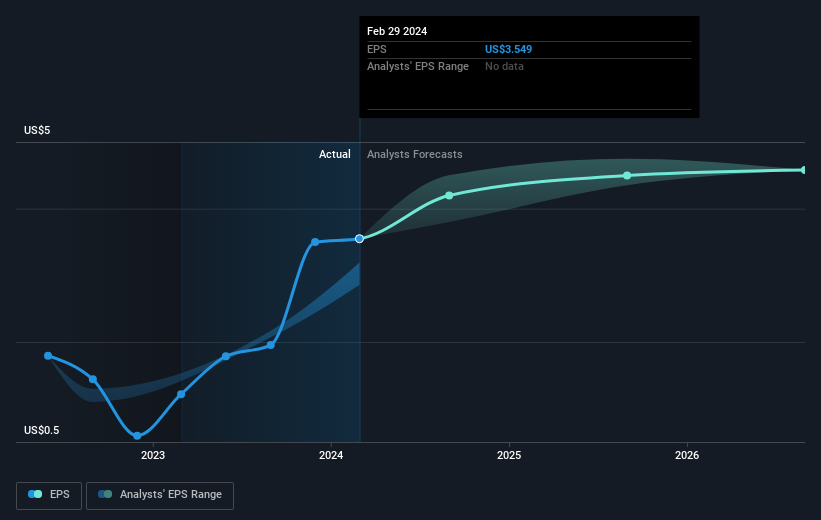
Greenbrier Companies was able to grow EPS by 192% in the last twelve months. It's fair to say that the share price gain of 83% did not keep pace with the EPS growth. Therefore, it seems the market isn't as excited about Greenbrier Companies as it was before. This could be an opportunity.
The company's earnings per share (over time) is depicted in the image below (click to see the exact numbers).
We consider it positive that insiders have made significant purchases in the last year. Having said that, most people consider earnings and revenue growth trends to be a more meaningful guide to the business. Before buying or selling a stock, we always recommend a close examination of historic growth trends, available here..
What About Dividends?
When looking at investment returns, it is important to consider the difference between total shareholder return (TSR) and share price return. The TSR is a return calculation that accounts for the value of cash dividends (assuming that any dividend received was reinvested) and the calculated value of any discounted capital raisings and spin-offs. Arguably, the TSR gives a more comprehensive picture of the return generated by a stock. We note that for Greenbrier Companies the TSR over the last 1 year was 89%, which is better than the share price return mentioned above. This is largely a result of its dividend payments!
A Different Perspective
It's good to see that Greenbrier Companies has rewarded shareholders with a total shareholder return of 89% in the last twelve months. Of course, that includes the dividend. Since the one-year TSR is better than the five-year TSR (the latter coming in at 15% per year), it would seem that the stock's performance has improved in recent times. Given the share price momentum remains strong, it might be worth taking a closer look at the stock, lest you miss an opportunity. While it is well worth considering the different impacts that market conditions can have on the share price, there are other factors that are even more important. Consider for instance, the ever-present spectre of investment risk. We've identified 3 warning signs with Greenbrier Companies (at least 1 which is a bit unpleasant) , and understanding them should be part of your investment process.
There are plenty of other companies that have insiders buying up shares. You probably do not want to miss this free list of undervalued small cap companies that insiders are buying.
Please note, the market returns quoted in this article reflect the market weighted average returns of stocks that currently trade on American exchanges.
New: Manage All Your Stock Portfolios in One Place
We've created the ultimate portfolio companion for stock investors, and it's free.
• Connect an unlimited number of Portfolios and see your total in one currency
• Be alerted to new Warning Signs or Risks via email or mobile
• Track the Fair Value of your stocks
Have feedback on this article? Concerned about the content? Get in touch with us directly. Alternatively, email editorial-team (at) simplywallst.com.
This article by Simply Wall St is general in nature. We provide commentary based on historical data and analyst forecasts only using an unbiased methodology and our articles are not intended to be financial advice. It does not constitute a recommendation to buy or sell any stock, and does not take account of your objectives, or your financial situation. We aim to bring you long-term focused analysis driven by fundamental data. Note that our analysis may not factor in the latest price-sensitive company announcements or qualitative material. Simply Wall St has no position in any stocks mentioned.
About NYSE:GBX
Greenbrier Companies
Designs, manufactures, and markets railroad freight car equipment in North America, Europe, and South America.
Solid track record average dividend payer.
