
Advertisement
- United States
- /
- Machinery
- /
- NYSE:EPAC
A Look At The Intrinsic Value Of Enerpac Tool Group Corp. (NYSE:EPAC)
Key Insights
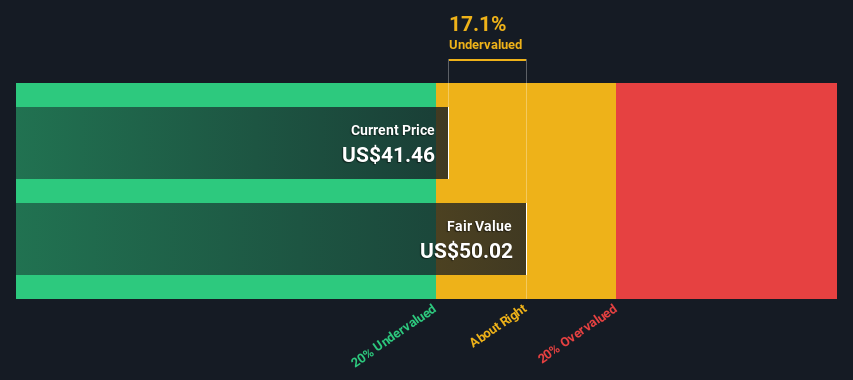
- Using the 2 Stage Free Cash Flow to Equity, Enerpac Tool Group fair value estimate is US$50.02
- Enerpac Tool Group's US$41.46 share price indicates it is trading at similar levels as its fair value estimate
How far off is Enerpac Tool Group Corp. (NYSE:EPAC) from its intrinsic value? Using the most recent financial data, we'll take a look at whether the stock is fairly priced by estimating the company's future cash flows and discounting them to their present value. Our analysis will employ the Discounted Cash Flow (DCF) model. Models like these may appear beyond the comprehension of a lay person, but they're fairly easy to follow.
Remember though, that there are many ways to estimate a company's value, and a DCF is just one method. If you want to learn more about discounted cash flow, the rationale behind this calculation can be read in detail in the Simply Wall St analysis model.
View our latest analysis for Enerpac Tool Group
Step By Step Through The Calculation
We are going to use a two-stage DCF model, which, as the name states, takes into account two stages of growth. The first stage is generally a higher growth period which levels off heading towards the terminal value, captured in the second 'steady growth' period. In the first stage we need to estimate the cash flows to the business over the next ten years. Seeing as no analyst estimates of free cash flow are available to us, we have extrapolate the previous free cash flow (FCF) from the company's last reported value. We assume companies with shrinking free cash flow will slow their rate of shrinkage, and that companies with growing free cash flow will see their growth rate slow, over this period. We do this to reflect that growth tends to slow more in the early years than it does in later years.
A DCF is all about the idea that a dollar in the future is less valuable than a dollar today, so we need to discount the sum of these future cash flows to arrive at a present value estimate:
10-year free cash flow (FCF) estimate
| 2025 | 2026 | 2027 | 2028 | 2029 | 2030 | 2031 | 2032 | 2033 | 2034 | |
| Levered FCF ($, Millions) | US$90.5m | US$100.8m | US$109.6m | US$117.2m | US$123.7m | US$129.4m | US$134.6m | US$139.4m | US$143.9m | US$148.3m |
| Growth Rate Estimate Source | Est @ 15.27% | Est @ 11.44% | Est @ 8.76% | Est @ 6.88% | Est @ 5.57% | Est @ 4.65% | Est @ 4.00% | Est @ 3.55% | Est @ 3.24% | Est @ 3.02% |
| Present Value ($, Millions) Discounted @ 6.8% | US$84.7 | US$88.5 | US$90.1 | US$90.2 | US$89.2 | US$87.5 | US$85.2 | US$82.7 | US$79.9 | US$77.2 |
("Est" = FCF growth rate estimated by Simply Wall St)
Present Value of 10-year Cash Flow (PVCF) = US$855m
After calculating the present value of future cash flows in the initial 10-year period, we need to calculate the Terminal Value, which accounts for all future cash flows beyond the first stage. For a number of reasons a very conservative growth rate is used that cannot exceed that of a country's GDP growth. In this case we have used the 5-year average of the 10-year government bond yield (2.5%) to estimate future growth. In the same way as with the 10-year 'growth' period, we discount future cash flows to today's value, using a cost of equity of 6.8%.
Terminal Value (TV)= FCF2034 × (1 + g) ÷ (r – g) = US$148m× (1 + 2.5%) ÷ (6.8%– 2.5%) = US$3.6b
Present Value of Terminal Value (PVTV)= TV / (1 + r)10= US$3.6b÷ ( 1 + 6.8%)10= US$1.9b
The total value, or equity value, is then the sum of the present value of the future cash flows, which in this case is US$2.7b. To get the intrinsic value per share, we divide this by the total number of shares outstanding. Compared to the current share price of US$41.5, the company appears about fair value at a 17% discount to where the stock price trades currently. Valuations are imprecise instruments though, rather like a telescope - move a few degrees and end up in a different galaxy. Do keep this in mind.
Important Assumptions
We would point out that the most important inputs to a discounted cash flow are the discount rate and of course the actual cash flows. If you don't agree with these result, have a go at the calculation yourself and play with the assumptions. The DCF also does not consider the possible cyclicality of an industry, or a company's future capital requirements, so it does not give a full picture of a company's potential performance. Given that we are looking at Enerpac Tool Group as potential shareholders, the cost of equity is used as the discount rate, rather than the cost of capital (or weighted average cost of capital, WACC) which accounts for debt. In this calculation we've used 6.8%, which is based on a levered beta of 1.032. Beta is a measure of a stock's volatility, compared to the market as a whole. We get our beta from the industry average beta of globally comparable companies, with an imposed limit between 0.8 and 2.0, which is a reasonable range for a stable business.
SWOT Analysis for Enerpac Tool Group
Strength
- Earnings growth over the past year exceeded the industry.
- Debt is not viewed as a risk.
Weakness
- Dividend is low compared to the top 25% of dividend payers in the Machinery market.
Opportunity
- Annual earnings are forecast to grow faster than the American market.
- Current share price is below our estimate of fair value.
Threat
- No apparent threats visible for EPAC.
Looking Ahead:
Valuation is only one side of the coin in terms of building your investment thesis, and it shouldn't be the only metric you look at when researching a company. The DCF model is not a perfect stock valuation tool. Instead the best use for a DCF model is to test certain assumptions and theories to see if they would lead to the company being undervalued or overvalued. For instance, if the terminal value growth rate is adjusted slightly, it can dramatically alter the overall result. For Enerpac Tool Group, we've put together three pertinent items you should further research:
- Financial Health: Does EPAC have a healthy balance sheet? Take a look at our free balance sheet analysis with six simple checks on key factors like leverage and risk.
- Future Earnings: How does EPAC's growth rate compare to its peers and the wider market? Dig deeper into the analyst consensus number for the upcoming years by interacting with our free analyst growth expectation chart.
- Other High Quality Alternatives: Do you like a good all-rounder? Explore our interactive list of high quality stocks to get an idea of what else is out there you may be missing!
PS. The Simply Wall St app conducts a discounted cash flow valuation for every stock on the NYSE every day. If you want to find the calculation for other stocks just search here.
Valuation is complex, but we're here to simplify it.
Discover if Enerpac Tool Group might be undervalued or overvalued with our detailed analysis, featuring fair value estimates, potential risks, dividends, insider trades, and its financial condition.
Access Free AnalysisHave feedback on this article? Concerned about the content? Get in touch with us directly. Alternatively, email editorial-team (at) simplywallst.com.
This article by Simply Wall St is general in nature. We provide commentary based on historical data and analyst forecasts only using an unbiased methodology and our articles are not intended to be financial advice. It does not constitute a recommendation to buy or sell any stock, and does not take account of your objectives, or your financial situation. We aim to bring you long-term focused analysis driven by fundamental data. Note that our analysis may not factor in the latest price-sensitive company announcements or qualitative material. Simply Wall St has no position in any stocks mentioned.
About NYSE:EPAC
Enerpac Tool Group
Manufactures and sells a range of industrial products and solutions in the United States, the United Kingdom, Germany, Australia, Canada, China, Saudi Arabia, Brazil, France, and internationally.
Flawless balance sheet with solid track record.
Similar Companies
Market Insights

Advertisement
Community Narratives
The Next Phase of Energy Storage: How NeoVolta Is Tackling America’s Power Crunch
Fair Value US$7.50|23.7% undervalued
MA
Community Contributor
A formidable player in AI and enterprise computing.
Fair Value US$210.00|0.7% overvalued
CO
Community Contributor
IREN's Bold Moves in Sustainable Bitcoin Mining & AI Data Centers
Fair Value US$72.52|14.9% undervalued
BL
Community Contributor
Cooling the Champions: The Aussie Tech Behind F1's Victories
Fair Value AU$12.40|38.1% undervalued
TR
Community Contributor