
Advertisement
- United States
- /
- Electrical
- /
- NYSE:EAF
GrafTech International Ltd.'s (NYSE:EAF) Share Price Boosted 29% But Its Business Prospects Need A Lift Too
GrafTech International Ltd. (NYSE:EAF) shareholders would be excited to see that the share price has had a great month, posting a 29% gain and recovering from prior weakness. But the last month did very little to improve the 64% share price decline over the last year.
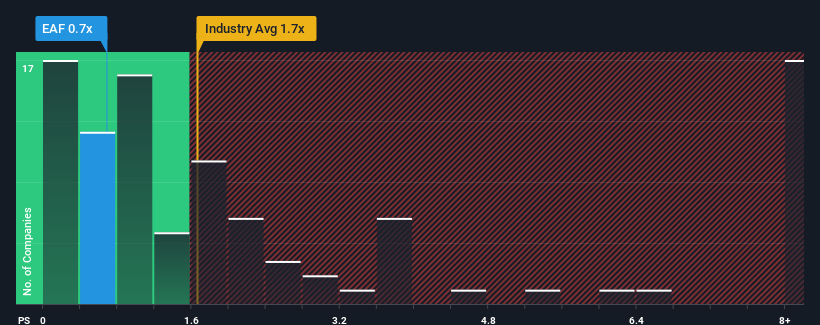
In spite of the firm bounce in price, GrafTech International's price-to-sales (or "P/S") ratio of 0.7x might still make it look like a buy right now compared to the Electrical industry in the United States, where around half of the companies have P/S ratios above 1.7x and even P/S above 4x are quite common. Although, it's not wise to just take the P/S at face value as there may be an explanation why it's limited.
See our latest analysis for GrafTech International
How Has GrafTech International Performed Recently?
While the industry has experienced revenue growth lately, GrafTech International's revenue has gone into reverse gear, which is not great. Perhaps the P/S remains low as investors think the prospects of strong revenue growth aren't on the horizon. If you still like the company, you'd be hoping this isn't the case so that you could potentially pick up some stock while it's out of favour.
If you'd like to see what analysts are forecasting going forward, you should check out our free report on GrafTech International.What Are Revenue Growth Metrics Telling Us About The Low P/S?
There's an inherent assumption that a company should underperform the industry for P/S ratios like GrafTech International's to be considered reasonable.
In reviewing the last year of financials, we were disheartened to see the company's revenues fell to the tune of 52%. As a result, revenue from three years ago have also fallen 49% overall. So unfortunately, we have to acknowledge that the company has not done a great job of growing revenue over that time.
Looking ahead now, revenue is anticipated to climb by 15% per year during the coming three years according to the five analysts following the company. That's shaping up to be materially lower than the 36% each year growth forecast for the broader industry.
With this information, we can see why GrafTech International is trading at a P/S lower than the industry. Apparently many shareholders weren't comfortable holding on while the company is potentially eyeing a less prosperous future.
What Does GrafTech International's P/S Mean For Investors?
GrafTech International's stock price has surged recently, but its but its P/S still remains modest. While the price-to-sales ratio shouldn't be the defining factor in whether you buy a stock or not, it's quite a capable barometer of revenue expectations.
As expected, our analysis of GrafTech International's analyst forecasts confirms that the company's underwhelming revenue outlook is a major contributor to its low P/S. At this stage investors feel the potential for an improvement in revenue isn't great enough to justify a higher P/S ratio. It's hard to see the share price rising strongly in the near future under these circumstances.
It is also worth noting that we have found 2 warning signs for GrafTech International (1 is a bit unpleasant!) that you need to take into consideration.
Of course, profitable companies with a history of great earnings growth are generally safer bets. So you may wish to see this free collection of other companies that have reasonable P/E ratios and have grown earnings strongly.
New: Manage All Your Stock Portfolios in One Place
We've created the ultimate portfolio companion for stock investors, and it's free.
• Connect an unlimited number of Portfolios and see your total in one currency
• Be alerted to new Warning Signs or Risks via email or mobile
• Track the Fair Value of your stocks
Have feedback on this article? Concerned about the content? Get in touch with us directly. Alternatively, email editorial-team (at) simplywallst.com.
This article by Simply Wall St is general in nature. We provide commentary based on historical data and analyst forecasts only using an unbiased methodology and our articles are not intended to be financial advice. It does not constitute a recommendation to buy or sell any stock, and does not take account of your objectives, or your financial situation. We aim to bring you long-term focused analysis driven by fundamental data. Note that our analysis may not factor in the latest price-sensitive company announcements or qualitative material. Simply Wall St has no position in any stocks mentioned.
About NYSE:EAF
GrafTech International
Research, develops, manufactures, and sells graphite and carbon-based solutions worldwide.
Fair value with low risk.
Similar Companies
Market Insights

Advertisement
Community Narratives
Quality at a Premium. A time to watch, not to buy?
Fair Value US$154.56|30.1% undervalued
DA
Community Contributor
GRAB: The Super-App at the Heart of Southeast Asia’s Digital Boom
Fair Value US$8.20|25.6% undervalued
BL
Community Contributor
Verve Group to Surge with 51.61% Revenue Growth
Fair Value €6.00|64.1% undervalued
ME
Community Contributor