
Advertisement
- United States
- /
- Building
- /
- NYSE:AWI
Armstrong World Industries, Inc. (NYSE:AWI) Shares Could Be 34% Below Their Intrinsic Value Estimate

Key Insights
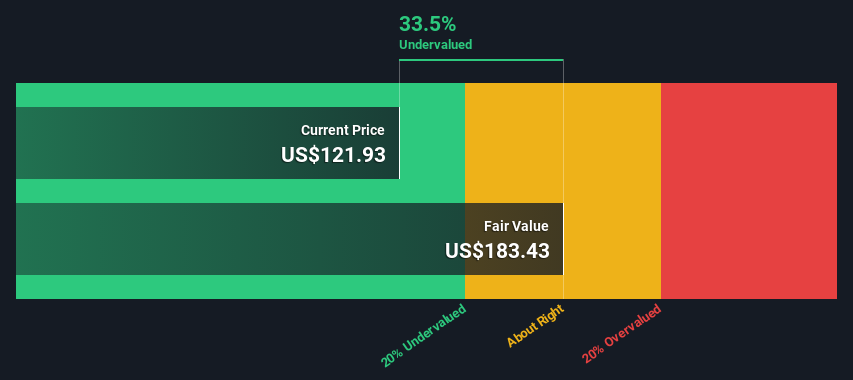
- The projected fair value for Armstrong World Industries is US$183 based on 2 Stage Free Cash Flow to Equity
- Armstrong World Industries is estimated to be 34% undervalued based on current share price of US$122
- Our fair value estimate is 35% higher than Armstrong World Industries' analyst price target of US$136
How far off is Armstrong World Industries, Inc. (NYSE:AWI) from its intrinsic value? Using the most recent financial data, we'll take a look at whether the stock is fairly priced by projecting its future cash flows and then discounting them to today's value. We will use the Discounted Cash Flow (DCF) model on this occasion. It may sound complicated, but actually it is quite simple!
We generally believe that a company's value is the present value of all of the cash it will generate in the future. However, a DCF is just one valuation metric among many, and it is not without flaws. Anyone interested in learning a bit more about intrinsic value should have a read of the Simply Wall St analysis model.
See our latest analysis for Armstrong World Industries
Crunching The Numbers
We are going to use a two-stage DCF model, which, as the name states, takes into account two stages of growth. The first stage is generally a higher growth period which levels off heading towards the terminal value, captured in the second 'steady growth' period. In the first stage we need to estimate the cash flows to the business over the next ten years. Where possible we use analyst estimates, but when these aren't available we extrapolate the previous free cash flow (FCF) from the last estimate or reported value. We assume companies with shrinking free cash flow will slow their rate of shrinkage, and that companies with growing free cash flow will see their growth rate slow, over this period. We do this to reflect that growth tends to slow more in the early years than it does in later years.
A DCF is all about the idea that a dollar in the future is less valuable than a dollar today, so we discount the value of these future cash flows to their estimated value in today's dollars:
10-year free cash flow (FCF) estimate
| 2025 | 2026 | 2027 | 2028 | 2029 | 2030 | 2031 | 2032 | 2033 | 2034 | |
| Levered FCF ($, Millions) | US$253.3m | US$299.3m | US$339.6m | US$374.1m | US$403.5m | US$428.8m | US$450.8m | US$470.4m | US$488.2m | US$504.8m |
| Growth Rate Estimate Source | Analyst x1 | Est @ 18.15% | Est @ 13.46% | Est @ 10.17% | Est @ 7.87% | Est @ 6.26% | Est @ 5.13% | Est @ 4.34% | Est @ 3.79% | Est @ 3.40% |
| Present Value ($, Millions) Discounted @ 7.3% | US$236 | US$260 | US$275 | US$282 | US$284 | US$281 | US$275 | US$268 | US$259 | US$250 |
("Est" = FCF growth rate estimated by Simply Wall St)
Present Value of 10-year Cash Flow (PVCF) = US$2.7b
After calculating the present value of future cash flows in the initial 10-year period, we need to calculate the Terminal Value, which accounts for all future cash flows beyond the first stage. The Gordon Growth formula is used to calculate Terminal Value at a future annual growth rate equal to the 5-year average of the 10-year government bond yield of 2.5%. We discount the terminal cash flows to today's value at a cost of equity of 7.3%.
Terminal Value (TV)= FCF2034 × (1 + g) ÷ (r – g) = US$505m× (1 + 2.5%) ÷ (7.3%– 2.5%) = US$11b
Present Value of Terminal Value (PVTV)= TV / (1 + r)10= US$11b÷ ( 1 + 7.3%)10= US$5.3b
The total value, or equity value, is then the sum of the present value of the future cash flows, which in this case is US$8.0b. The last step is to then divide the equity value by the number of shares outstanding. Compared to the current share price of US$122, the company appears quite undervalued at a 34% discount to where the stock price trades currently. Remember though, that this is just an approximate valuation, and like any complex formula - garbage in, garbage out.
Important Assumptions
The calculation above is very dependent on two assumptions. The first is the discount rate and the other is the cash flows. Part of investing is coming up with your own evaluation of a company's future performance, so try the calculation yourself and check your own assumptions. The DCF also does not consider the possible cyclicality of an industry, or a company's future capital requirements, so it does not give a full picture of a company's potential performance. Given that we are looking at Armstrong World Industries as potential shareholders, the cost of equity is used as the discount rate, rather than the cost of capital (or weighted average cost of capital, WACC) which accounts for debt. In this calculation we've used 7.3%, which is based on a levered beta of 1.162. Beta is a measure of a stock's volatility, compared to the market as a whole. We get our beta from the industry average beta of globally comparable companies, with an imposed limit between 0.8 and 2.0, which is a reasonable range for a stable business.
SWOT Analysis for Armstrong World Industries
Strength
- Earnings growth over the past year exceeded the industry.
- Debt is well covered by earnings and cashflows.
- Dividends are covered by earnings and cash flows.
Weakness
- Earnings growth over the past year is below its 5-year average.
- Dividend is low compared to the top 25% of dividend payers in the Building market.
Opportunity
- Annual earnings are forecast to grow for the next 3 years.
- Trading below our estimate of fair value by more than 20%.
Threat
- Annual earnings are forecast to grow slower than the American market.
Moving On:
Whilst important, the DCF calculation is only one of many factors that you need to assess for a company. DCF models are not the be-all and end-all of investment valuation. Preferably you'd apply different cases and assumptions and see how they would impact the company's valuation. For example, changes in the company's cost of equity or the risk free rate can significantly impact the valuation. Can we work out why the company is trading at a discount to intrinsic value? For Armstrong World Industries, we've compiled three relevant items you should explore:
- Risks: For instance, we've identified 1 warning sign for Armstrong World Industries that you should be aware of.
- Management:Have insiders been ramping up their shares to take advantage of the market's sentiment for AWI's future outlook? Check out our management and board analysis with insights on CEO compensation and governance factors.
- Other Solid Businesses: Low debt, high returns on equity and good past performance are fundamental to a strong business. Why not explore our interactive list of stocks with solid business fundamentals to see if there are other companies you may not have considered!
PS. Simply Wall St updates its DCF calculation for every American stock every day, so if you want to find the intrinsic value of any other stock just search here.
New: Manage All Your Stock Portfolios in One Place
We've created the ultimate portfolio companion for stock investors, and it's free.
• Connect an unlimited number of Portfolios and see your total in one currency
• Be alerted to new Warning Signs or Risks via email or mobile
• Track the Fair Value of your stocks
Have feedback on this article? Concerned about the content? Get in touch with us directly. Alternatively, email editorial-team (at) simplywallst.com.
This article by Simply Wall St is general in nature. We provide commentary based on historical data and analyst forecasts only using an unbiased methodology and our articles are not intended to be financial advice. It does not constitute a recommendation to buy or sell any stock, and does not take account of your objectives, or your financial situation. We aim to bring you long-term focused analysis driven by fundamental data. Note that our analysis may not factor in the latest price-sensitive company announcements or qualitative material. Simply Wall St has no position in any stocks mentioned.
About NYSE:AWI
Armstrong World Industries
Engages in the design, manufacture, and sale of ceiling and wall solutions in the Americas.
Solid track record with adequate balance sheet.
Similar Companies
Market Insights

Advertisement
Community Narratives
WhiteCap Is Positioned To Profit Regardless Of Trump's Policy 
Fair Value CA$22.60|61.7% undervalued
ST
Equity Analyst and Writer
Microsoft's Evolution Will Drive Revenue to New Heights Fueled by AI
Fair Value US$360.00|28.9% overvalued
BR
Community Contributor
A CASE FOR USD$2.50 (CAD$3.44) BY 2028 (A 5-10 BAGGER)
Fair Value CA$3.44|88.1% undervalued
AG
Community Contributor