
Advertisement
- United States
- /
- Aerospace & Defense
- /
- NasdaqGS:WWD
We Think Woodward (NASDAQ:WWD) Can Stay On Top Of Its Debt
Legendary fund manager Li Lu (who Charlie Munger backed) once said, 'The biggest investment risk is not the volatility of prices, but whether you will suffer a permanent loss of capital.' It's only natural to consider a company's balance sheet when you examine how risky it is, since debt is often involved when a business collapses. We note that Woodward, Inc. (NASDAQ:WWD) does have debt on its balance sheet. But is this debt a concern to shareholders?
When Is Debt Dangerous?
Debt and other liabilities become risky for a business when it cannot easily fulfill those obligations, either with free cash flow or by raising capital at an attractive price. Part and parcel of capitalism is the process of 'creative destruction' where failed businesses are mercilessly liquidated by their bankers. However, a more frequent (but still costly) occurrence is where a company must issue shares at bargain-basement prices, permanently diluting shareholders, just to shore up its balance sheet. Of course, debt can be an important tool in businesses, particularly capital heavy businesses. The first thing to do when considering how much debt a business uses is to look at its cash and debt together.
What Is Woodward's Debt?
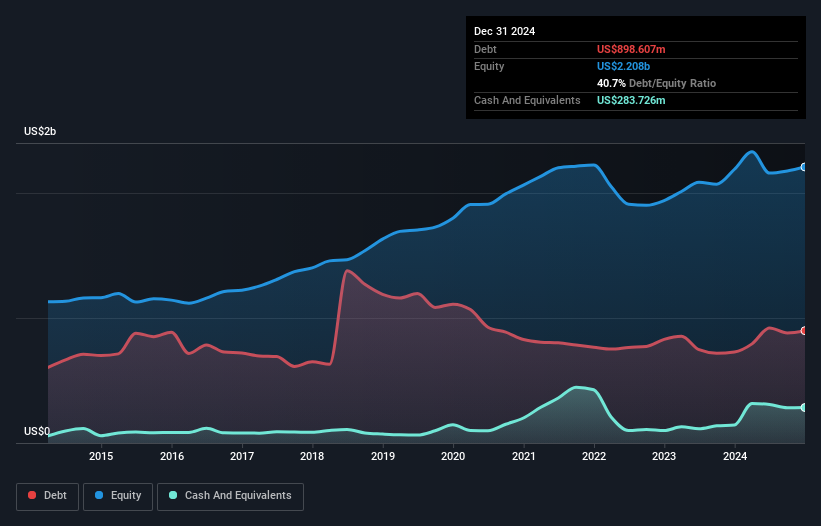
You can click the graphic below for the historical numbers, but it shows that as of December 2024 Woodward had US$898.6m of debt, an increase on US$727.9m, over one year. However, it does have US$283.7m in cash offsetting this, leading to net debt of about US$614.9m.
How Healthy Is Woodward's Balance Sheet?
According to the last reported balance sheet, Woodward had liabilities of US$914.8m due within 12 months, and liabilities of US$1.16b due beyond 12 months. Offsetting this, it had US$283.7m in cash and US$708.9m in receivables that were due within 12 months. So its liabilities outweigh the sum of its cash and (near-term) receivables by US$1.08b.
Given Woodward has a humongous market capitalization of US$11.0b, it's hard to believe these liabilities pose much threat. Having said that, it's clear that we should continue to monitor its balance sheet, lest it change for the worse.
Check out our latest analysis for Woodward
We use two main ratios to inform us about debt levels relative to earnings. The first is net debt divided by earnings before interest, tax, depreciation, and amortization (EBITDA), while the second is how many times its earnings before interest and tax (EBIT) covers its interest expense (or its interest cover, for short). This way, we consider both the absolute quantum of the debt, as well as the interest rates paid on it.
Woodward has a low net debt to EBITDA ratio of only 1.1. And its EBIT covers its interest expense a whopping 10.1 times over. So you could argue it is no more threatened by its debt than an elephant is by a mouse. Also positive, Woodward grew its EBIT by 21% in the last year, and that should make it easier to pay down debt, going forward. The balance sheet is clearly the area to focus on when you are analysing debt. But it is future earnings, more than anything, that will determine Woodward's ability to maintain a healthy balance sheet going forward. So if you're focused on the future you can check out this free report showing analyst profit forecasts.
But our final consideration is also important, because a company cannot pay debt with paper profits; it needs cold hard cash. So the logical step is to look at the proportion of that EBIT that is matched by actual free cash flow. During the last three years, Woodward produced sturdy free cash flow equating to 69% of its EBIT, about what we'd expect. This cold hard cash means it can reduce its debt when it wants to.
Our View
Woodward's interest cover suggests it can handle its debt as easily as Cristiano Ronaldo could score a goal against an under 14's goalkeeper. And that's just the beginning of the good news since its EBIT growth rate is also very heartening. Zooming out, Woodward seems to use debt quite reasonably; and that gets the nod from us. While debt does bring risk, when used wisely it can also bring a higher return on equity. Above most other metrics, we think its important to track how fast earnings per share is growing, if at all. If you've also come to that realization, you're in luck, because today you can view this interactive graph of Woodward's earnings per share history for free.
Of course, if you're the type of investor who prefers buying stocks without the burden of debt, then don't hesitate to discover our exclusive list of net cash growth stocks, today.
Valuation is complex, but we're here to simplify it.
Discover if Woodward might be undervalued or overvalued with our detailed analysis, featuring fair value estimates, potential risks, dividends, insider trades, and its financial condition.
Access Free AnalysisHave feedback on this article? Concerned about the content? Get in touch with us directly. Alternatively, email editorial-team (at) simplywallst.com.
This article by Simply Wall St is general in nature. We provide commentary based on historical data and analyst forecasts only using an unbiased methodology and our articles are not intended to be financial advice. It does not constitute a recommendation to buy or sell any stock, and does not take account of your objectives, or your financial situation. We aim to bring you long-term focused analysis driven by fundamental data. Note that our analysis may not factor in the latest price-sensitive company announcements or qualitative material. Simply Wall St has no position in any stocks mentioned.
About NasdaqGS:WWD
Woodward
Designs, manufactures, and services control solutions for the aerospace and industrial markets worldwide.
Flawless balance sheet with limited growth.
Similar Companies
Market Insights

Advertisement
Community Narratives
Finding The True Value Of A Logistics Powerhouse
Fair Value US$95.21|8.6% undervalued
NV
Community Contributor
Paradigm Biopharmaceuticals Will Lead Osteoarthritis Treatment with Zilosul's FDA Success
Fair Value AU$5.50|91.9% undervalued
AM
Community Contributor
Barrick Mining (ABX:CA): A Gold Hedge against a U.S. Shutdown
Fair Value CA$60.00|25.6% undervalued
GM
Community Contributor