Advertisement
- United States
- /
- Machinery
- /
- NasdaqGM:SYM
Assessing Symbotic’s Soaring Stock After Walmart Expands AI Robotics Partnership

Simply Wall St
Reviewed by Bailey Pemberton
If you have been watching Symbotic stock lately, you know it has been an exhilarating ride. Whether you are on the fence about buying, holding, or just plain curious, now is a fascinating time to dive in and assess what might come next. The company’s shares have caught serious momentum, surging 26.3% in the last week alone and clocking an eye-popping 174.5% gain year-to-date. Over the past year, the stock has climbed a stunning 186.0%. For those who got in three years ago, the return stands at a remarkable 423.5%. It is no exaggeration to say that Symbotic is on many investors’ radar screens right now, fueled by optimism around automation and supply chain tech in a market keen for game-changers.
That said, while growth stories can be thrilling, the real question is always the same: Is the current price justified, or has the excitement pushed shares too far, too fast? Symbotic’s value score sits at just 1 out of 6, meaning it only passes one measure of being undervalued. This brings us to the heart of any smart investing decision: How does this company stack up when we break down its numbers?
Next, let’s unpack the main valuation checks investors and analysts use to gauge whether Symbotic stock still has upside or if caution is warranted. And stick around, because after reviewing the common approaches, we will talk through an even more insightful way to look at valuation that most overlook.
Symbotic scores just 1/6 on our valuation checks. See what other red flags we found in the full valuation breakdown.
Approach 1: Symbotic Discounted Cash Flow (DCF) Analysis
The Discounted Cash Flow (DCF) model estimates a company’s true value by projecting its future cash flows and discounting them back to today’s dollars. This approach tries to account for both current financial strength and future growth potential, grounding valuations in real, expected performance.
For Symbotic, the latest available Free Cash Flow (FCF) stands at $188.3 Million. Analysts have provided projections for the next five years, with Free Cash Flow expected to accelerate rapidly. By 2030, the company’s FCF is forecasted to reach $1.13 Billion, an impressive trajectory that highlights strong expectations for business expansion and scale. Since analysts only cover the first five years in detail, additional growth is extrapolated using industry-standard techniques.
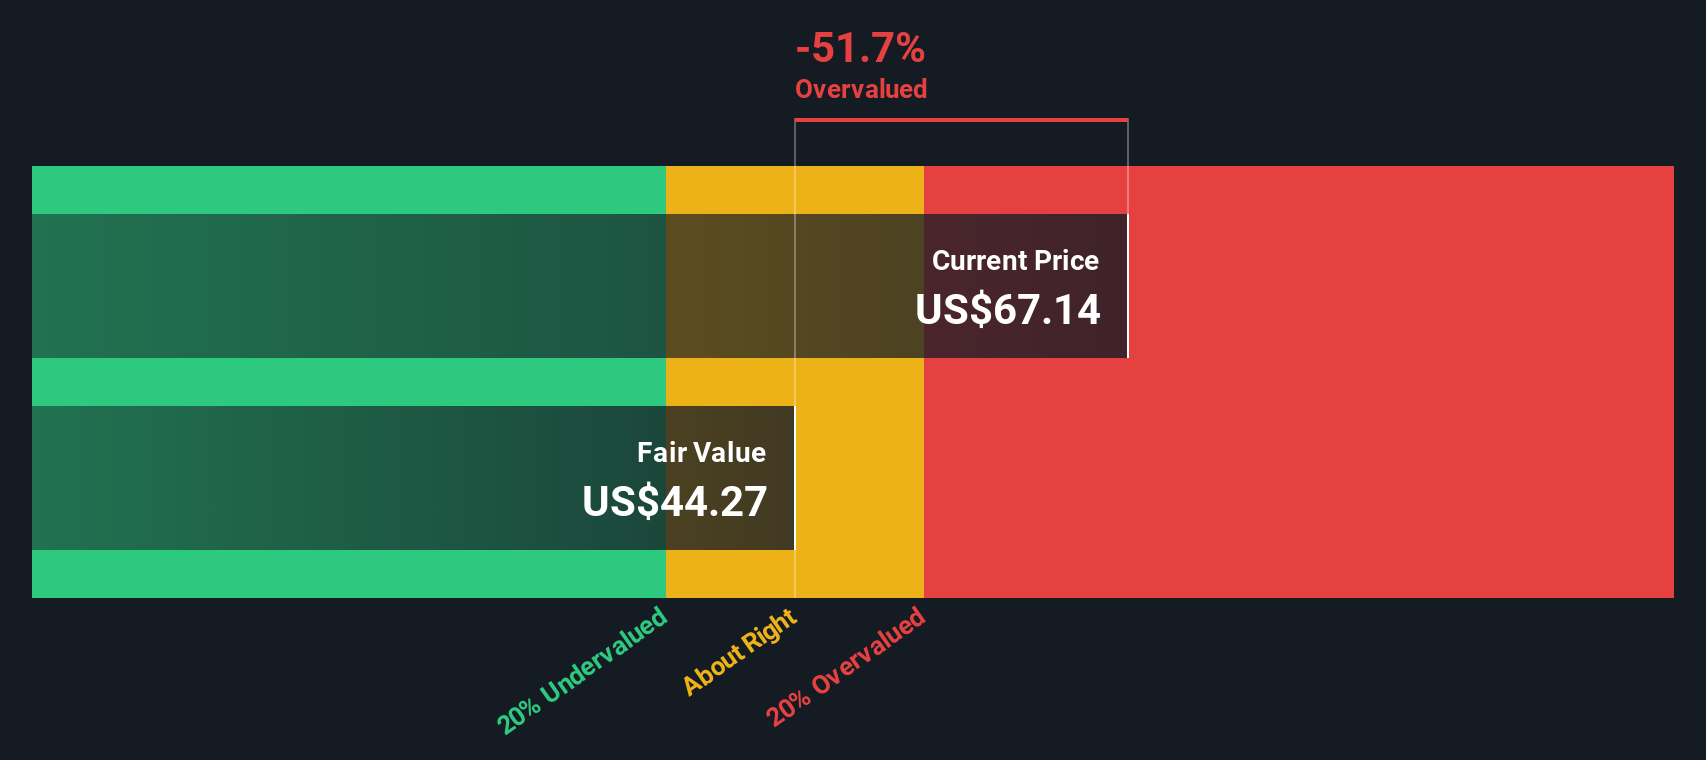
Based on these cash flow projections, the DCF model estimates Symbotic’s intrinsic value at $44.37 per share. However, the stock is currently trading 52.9% above this fair value, signaling it is significantly overvalued according to this measure. While the long-term outlook for growth is robust, the share price appears to have galloped ahead of fundamentals, at least from this perspective.
Result: OVERVALUED
Our Discounted Cash Flow (DCF) analysis suggests Symbotic may be overvalued by 52.9%. Find undervalued stocks or create your own screener to find better value opportunities.
Approach 2: Symbotic Price vs Sales (P/S) Ratio
The Price-to-Sales (P/S) ratio is a favored valuation tool, especially for companies like Symbotic that are in high-growth phases or not yet consistently profitable. This metric helps investors compare a company’s market value to its sales revenue, offering insight into how much the market is willing to pay for each dollar of revenue generated.
Growth expectations and risk play a big role in determining what constitutes a “normal” or “fair” P/S ratio. Companies with faster revenue growth and lower perceived risk typically deserve higher multiples, while those with less momentum or greater uncertainty tend to trade lower.
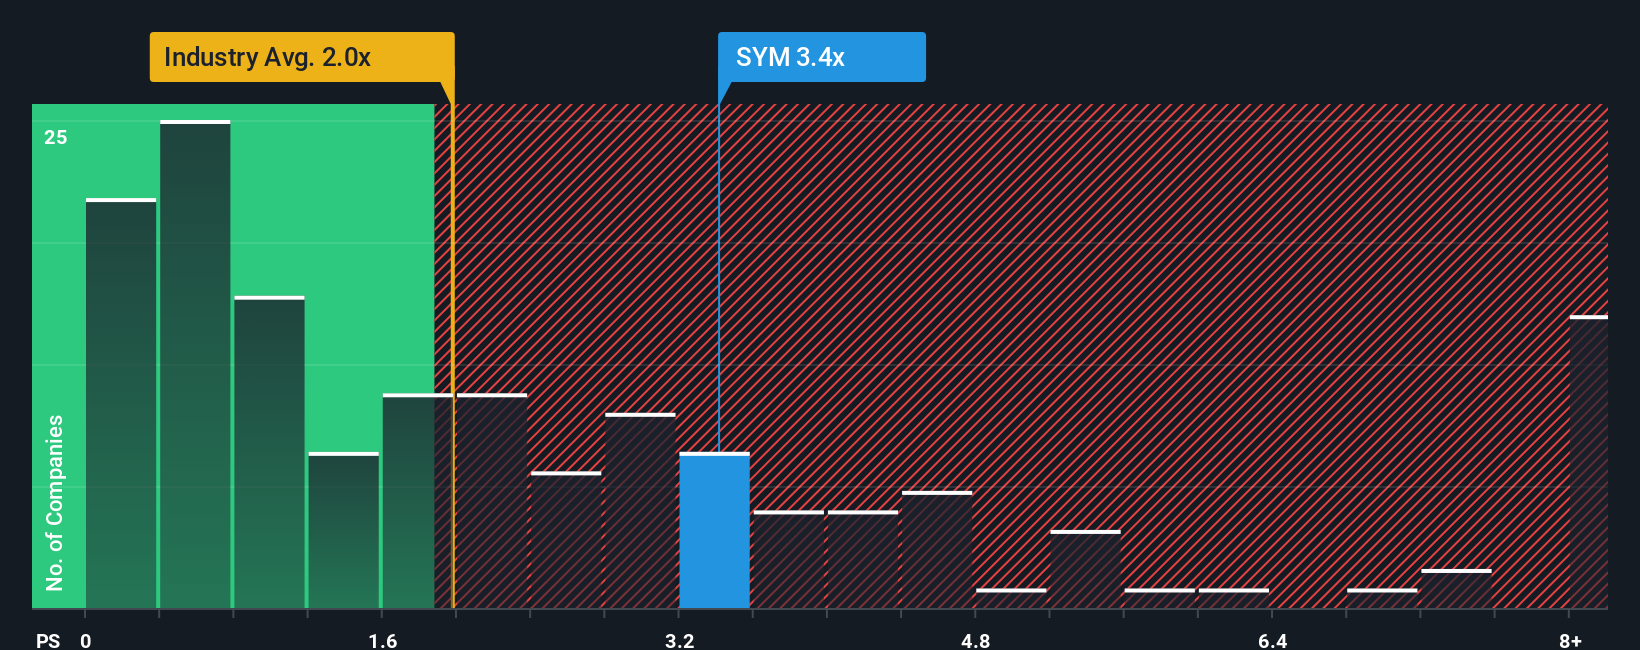
Symbotic currently sports a P/S ratio of 3.44x. This is above the average for its industry, which stands at 1.84x, and also higher than the average of its peer group, which is 3.33x. The story does not end there. Simply Wall St’s proprietary "Fair Ratio" adjusts for the company’s specific circumstances, factoring in its rapid growth, margins, market cap, and risk profile. For Symbotic, the Fair Ratio is calculated at 3.92x, suggesting that the company’s sales multiple is actually a bit below what would be considered fair once all these elements are considered.
The Fair Ratio offers a clearer picture than static peer or industry averages because it looks at what makes Symbotic unique, from growth trajectory to market risks, instead of just broad comparisons. When comparing the current 3.44x multiple to the Fair Ratio of 3.92x, the stock appears meaningfully undervalued by this approach.
Result: UNDERVALUED
PS ratios tell one story, but what if the real opportunity lies elsewhere? Discover companies where insiders are betting big on explosive growth.
Upgrade Your Decision Making: Choose your Symbotic Narrative
Earlier we mentioned that there is an even better way to understand valuation, so let’s introduce you to Narratives. A Narrative is your story about a company, built around the numbers. Instead of relying only on traditional valuation models, Narratives allow you to link Symbotic’s business drivers to your own financial forecasts and fair value estimates, creating an investment case based on what you believe matters most.
Narratives bridge the gap between a company’s story, its financial outlook, and a calculated fair value, helping investors visualize how a future shaped by real events could impact the share price. On Simply Wall St’s Community page, millions of investors use Narratives as an intuitive tool to test their convictions, quickly adjusting assumptions if, for example, new technology is released or earnings surprise to the upside.
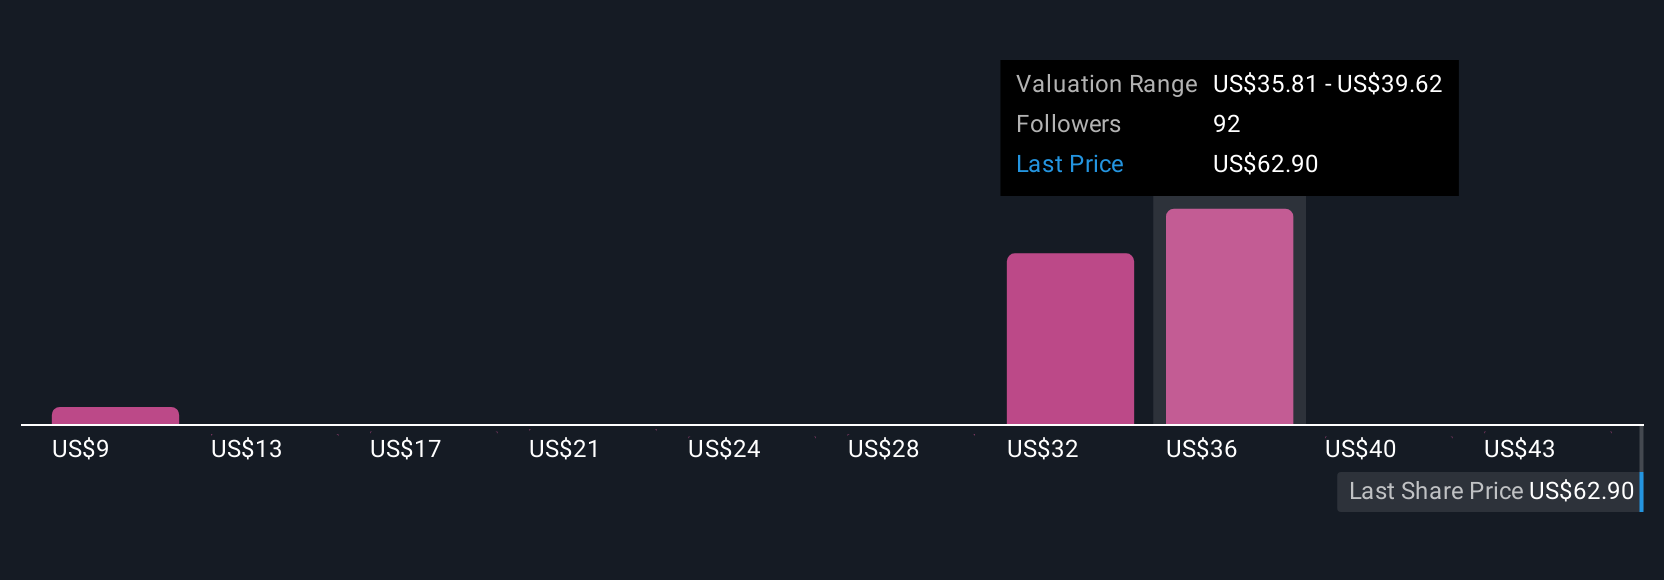
When a Narrative is updated with fresh information from news or reports, your fair value and decision point change too, guiding you on whether to buy or sell as circumstances evolve. For Symbotic, one investor’s Narrative might forecast aggressive e-commerce growth and assign a fair value of $60.00 per share, while another, more cautious about transition risks and competition, might see fair value near $10.00. Narratives make these perspectives simple to create and compare, powering sharper, more personal investment decisions for every type of investor.
Do you think there's more to the story for Symbotic? Create your own Narrative to let the Community know!
This article by Simply Wall St is general in nature. We provide commentary based on historical data and analyst forecasts only using an unbiased methodology and our articles are not intended to be financial advice. It does not constitute a recommendation to buy or sell any stock, and does not take account of your objectives, or your financial situation. We aim to bring you long-term focused analysis driven by fundamental data. Note that our analysis may not factor in the latest price-sensitive company announcements or qualitative material. Simply Wall St has no position in any stocks mentioned.
New: Manage All Your Stock Portfolios in One Place
We've created the ultimate portfolio companion for stock investors, and it's free.
• Connect an unlimited number of Portfolios and see your total in one currency
• Be alerted to new Warning Signs or Risks via email or mobile
• Track the Fair Value of your stocks
Have feedback on this article? Concerned about the content? Get in touch with us directly. Alternatively, email editorial-team@simplywallst.com
About NasdaqGM:SYM
Symbotic
An automation technology company, develops technologies to enhance operating efficiencies in modern warehouses.
Flawless balance sheet with high growth potential.
Similar Companies
Market Insights

Advertisement
Community Narratives
The Next Phase of Energy Storage: How NeoVolta Is Tackling America’s Power Crunch
Fair Value US$7.50|30.4% undervalued
MA
Community Contributor
A formidable player in AI and enterprise computing.
Fair Value US$210.00|3.0% undervalued
CO
Community Contributor
IREN's Bold Moves in Sustainable Bitcoin Mining & AI Data Centers
Fair Value US$72.52|20.4% undervalued
BL
Community Contributor
Cooling the Champions: The Aussie Tech Behind F1's Victories
Fair Value AU$12.40|38.1% undervalued
TR
Community Contributor