Advertisement
- United States
- /
- Machinery
- /
- NasdaqGS:PCAR
Weighing PACCAR’s Value After Three-Year 90% Surge and Industry Beat in 2025

Simply Wall St
Reviewed by Bailey Pemberton
Thinking about what to do with PACCAR shares? You are definitely not alone. In a market that has been anything but predictable lately, it is no wonder investors are digging deeper into stocks with a resilient track record and some hidden value. PACCAR, trading at $98.52 most recently, is drawing attention for good reason. Despite modest short-term dips, with the stock down 1.3% in the last week and off just 0.5% over the past month, the big picture is hard to ignore. Over the last three years, PACCAR shares have surged by an impressive 90.9%, and looking back five years, they are up nearly 97.4%. In the past year, the stock is only down 0.4%, showing real staying power amid market shifts.
This mixed bag of steady growth and recent sideways moves has a lot of investors wondering whether PACCAR is undervalued, overvalued, or sitting right where it should be. To help answer that, we have dug into six key ways analysts assess a company’s valuation. PACCAR scores a 3 out of 6 on this metric. That means it ticks the box for being undervalued in half of the checks. But as you will see, there is more to capturing true value than just checking off a few boxes. Next, let us break down those valuation approaches and reveal which ones PACCAR passes today. And if you are searching for an even smarter way to spot value, stick around because a more insightful method is coming up at the end.
Why PACCAR is lagging behind its peers
Approach 1: PACCAR Discounted Cash Flow (DCF) Analysis
The Discounted Cash Flow (DCF) model is a popular valuation approach that estimates a company's worth by forecasting its future cash flows and then discounting them back to their present value. In short, it asks what all of PACCAR's expected future cash earnings would be worth in today’s dollars.
PACCAR’s current Free Cash Flow stands at an impressive $3.1 Billion. Projections estimate that by 2029, annual free cash flow will be around $3.07 Billion. While analysts provide detailed forecasts for the next five years, future values beyond that are extrapolated for accuracy. The ten-year cash flow outlook includes estimates sourced from multiple analysts up to 2029, followed by calculated assumptions through 2035, with the final discounted figure gradually declining to just over $1 Billion by the end of the forecast period.
Based on this cash flow projection, the DCF model calculates PACCAR’s intrinsic value at $73.06 per share. Compared to the current share price of $98.52, the model suggests the stock is 34.8% overvalued if you rely strictly on these cash flow forecasts.
Result: OVERVALUED
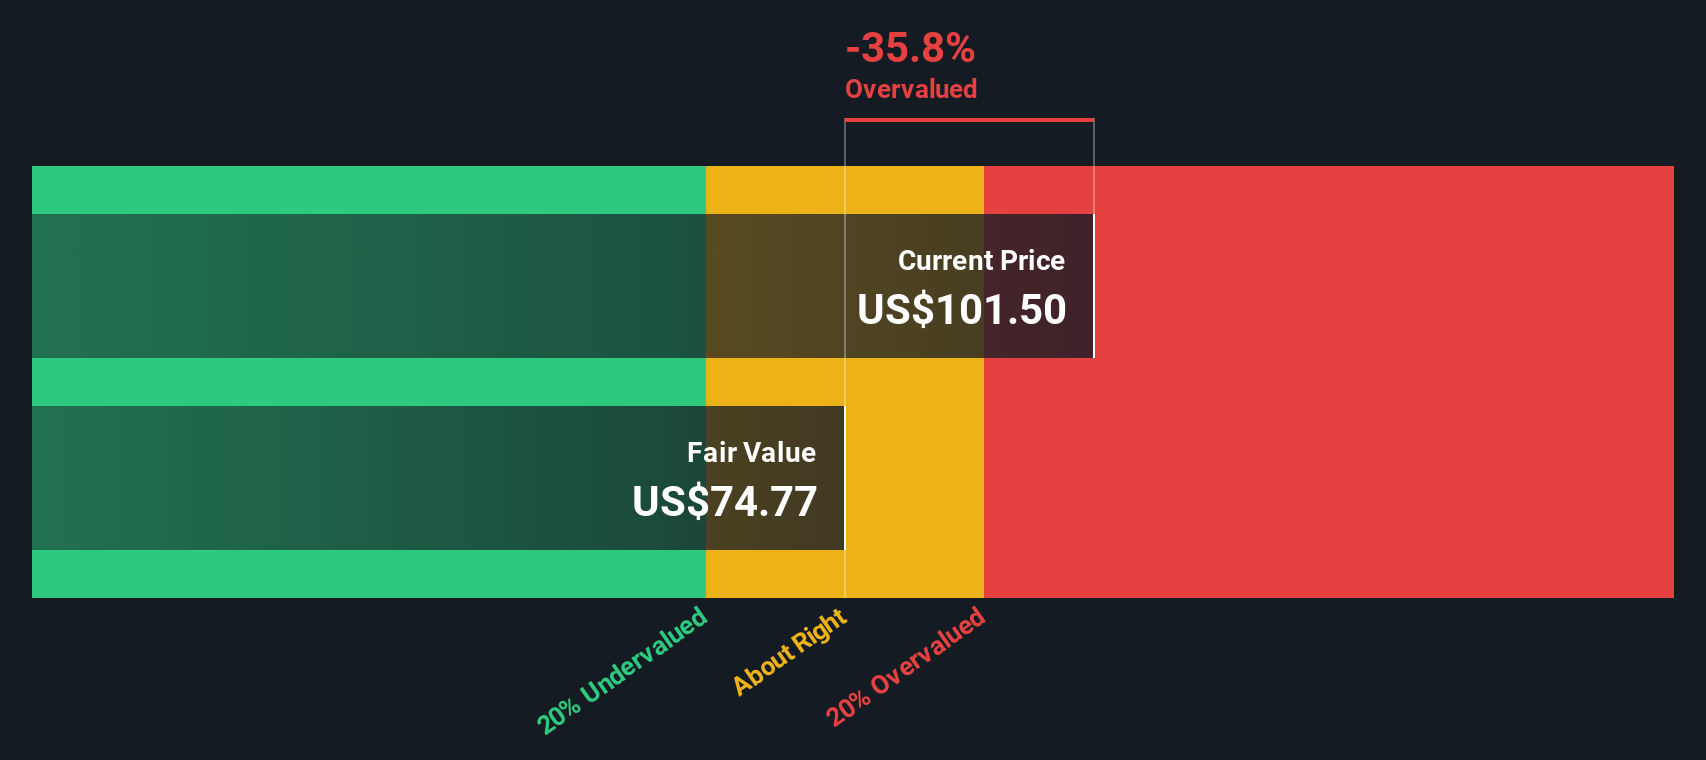
Our Discounted Cash Flow (DCF) analysis suggests PACCAR may be overvalued by 34.8%. Find undervalued stocks or create your own screener to find better value opportunities.
Approach 2: PACCAR Price vs Earnings
For profitable companies like PACCAR, the Price-to-Earnings (PE) ratio is one of the most widely used and effective valuation tools. It provides a quick snapshot of how much investors are willing to pay for each dollar of the company’s reported earnings. Generally, a higher PE suggests expectations of stronger future growth or lower risks, while a lower PE can signal either less optimism or greater uncertainty about future profits.
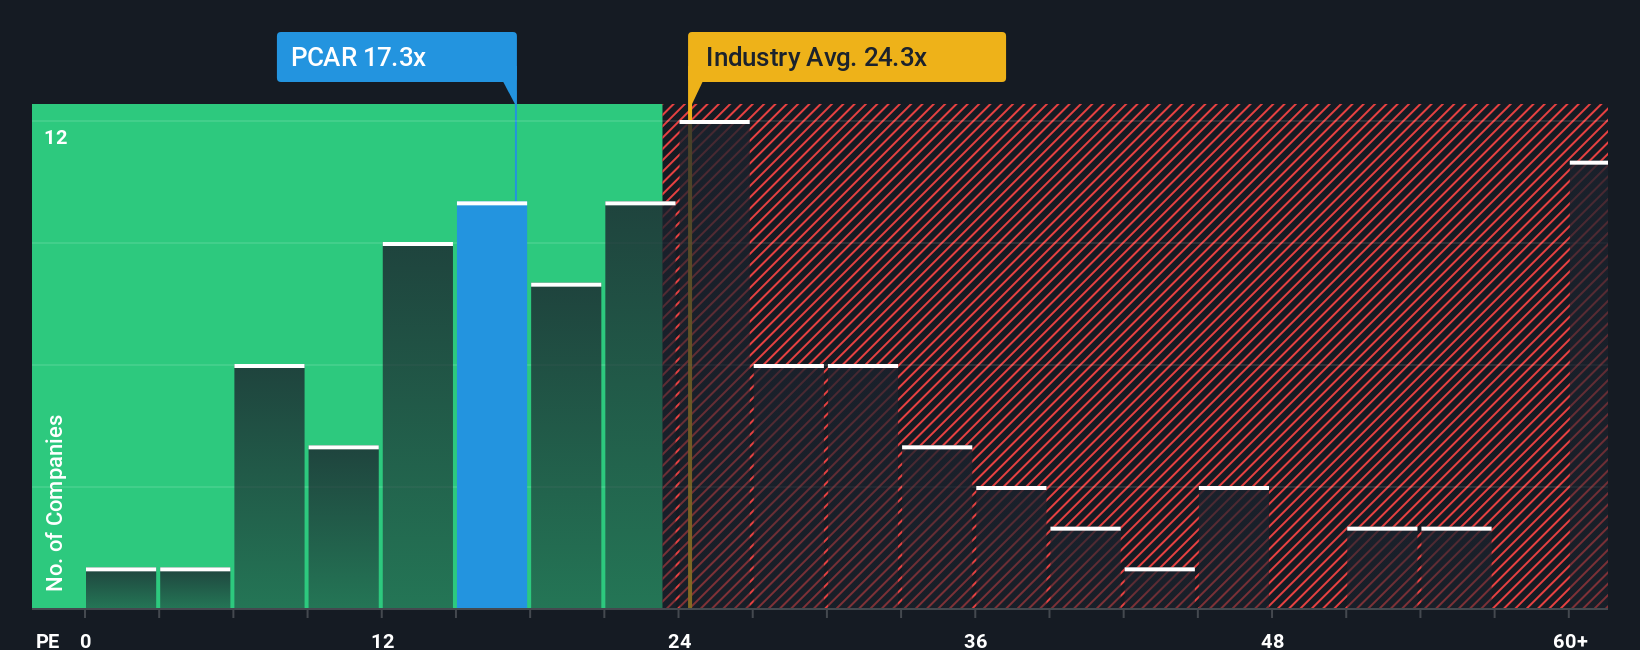
PACCAR currently trades at a PE ratio of 16.8x. To put this in perspective, the Machinery industry’s average PE is 24.1x, and the peer group average is 22.0x. On the surface, PACCAR’s valuation looks conservative compared to its industry and similar companies, potentially suggesting less optimism or a more stable earnings outlook.
However, Simply Wall St’s "Fair Ratio" goes beyond basic comparisons. It is a proprietary metric that estimates what PACCAR’s PE should be based on factors such as expected earnings growth, profit margins, industry trends, market cap, and business risks. This approach directly accounts for company-specific strengths and headwinds, not just broad averages. For PACCAR, the Fair Ratio is calculated at 28.9x. When all relevant drivers are considered, the stock could arguably justify a much higher valuation multiple.
Since PACCAR’s actual PE ratio of 16.8x is well below its Fair Ratio, the evidence points to the stock being undervalued on these metrics.
Result: UNDERVALUED
PE ratios tell one story, but what if the real opportunity lies elsewhere? Discover companies where insiders are betting big on explosive growth.
Upgrade Your Decision Making: Choose your PACCAR Narrative
Earlier we mentioned that there is an even better way to understand valuation, so let us introduce you to Narratives. A Narrative is a clear, accessible way for any investor to connect the story and outlook they believe about a company like PACCAR with their estimates for fair value, future revenue, earnings, and profit margins.
Instead of only looking at financial ratios or cash flow models, Narratives let you describe your perspective. For example, you can consider how you think regulatory changes or new technologies will shape PACCAR’s business and then translate that story into financial forecasts that drive your own estimate of the stock’s fair value.
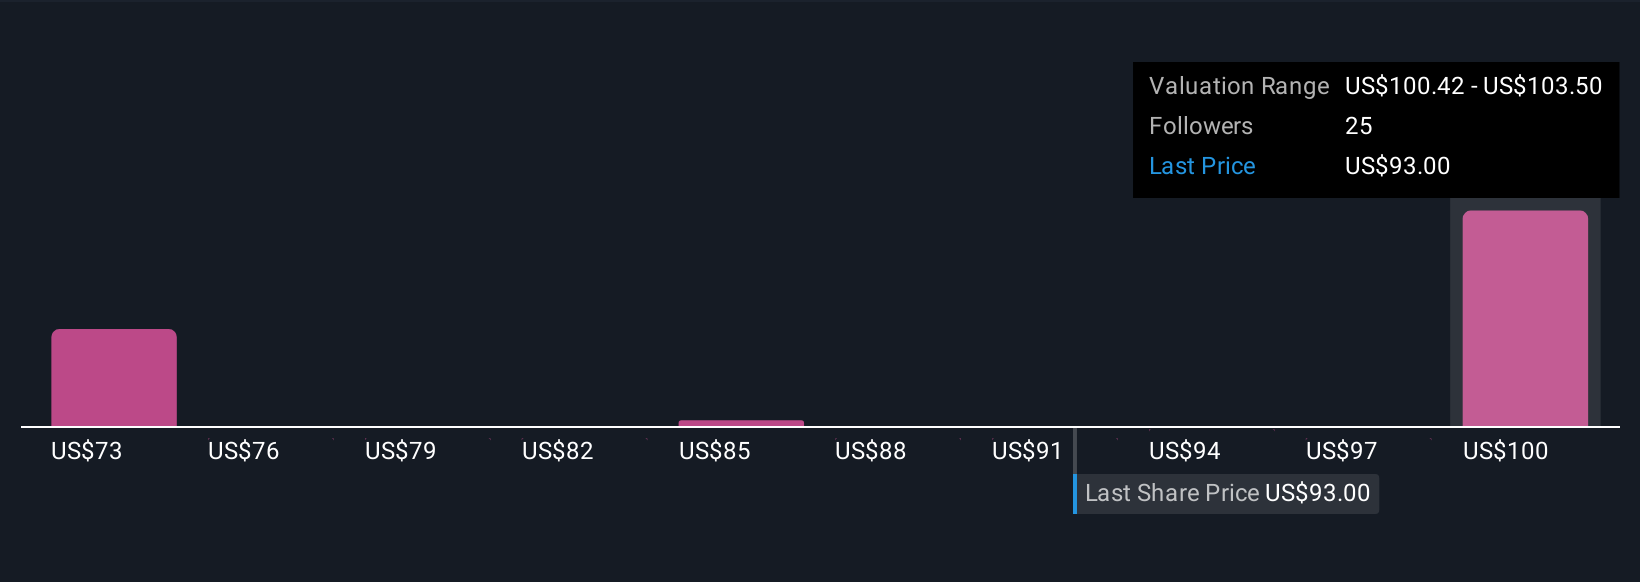
This approach links a company’s real-life story to its numbers, making investment decisions simpler and more personal. Narratives are available now for millions of users on Simply Wall St’s Community page and are an easy tool to help guide your buy or sell decisions by showing exactly where your Fair Value estimate sits relative to PACCAR’s current price.
Best of all, Narratives update dynamically whenever new information, news, or earnings reports become available, so your thesis and numbers stay relevant. For example, some PACCAR investors see strong emissions-related truck demand and set a Fair Value of $131, while more cautious perspectives, weighing risks like rising costs or market share pressure, land at $86.
Do you think there's more to the story for PACCAR? Create your own Narrative to let the Community know!
This article by Simply Wall St is general in nature. We provide commentary based on historical data and analyst forecasts only using an unbiased methodology and our articles are not intended to be financial advice. It does not constitute a recommendation to buy or sell any stock, and does not take account of your objectives, or your financial situation. We aim to bring you long-term focused analysis driven by fundamental data. Note that our analysis may not factor in the latest price-sensitive company announcements or qualitative material. Simply Wall St has no position in any stocks mentioned.
New: Manage All Your Stock Portfolios in One Place
We've created the ultimate portfolio companion for stock investors, and it's free.
• Connect an unlimited number of Portfolios and see your total in one currency
• Be alerted to new Warning Signs or Risks via email or mobile
• Track the Fair Value of your stocks
Have feedback on this article? Concerned about the content? Get in touch with us directly. Alternatively, email editorial-team@simplywallst.com
About NasdaqGS:PCAR
PACCAR
Designs, manufactures, and distributes light, medium, and heavy-duty commercial trucks in the United States, Canada, Europe, Mexico, South America, Australia, and internationally.
Excellent balance sheet average dividend payer.
Similar Companies
Market Insights

Advertisement
Community Narratives
The Next Phase of Energy Storage: How NeoVolta Is Tackling America’s Power Crunch
Fair Value US$7.50|30.4% undervalued
MA
Community Contributor
A formidable player in AI and enterprise computing.
Fair Value US$210.00|3.0% undervalued
CO
Community Contributor
IREN's Bold Moves in Sustainable Bitcoin Mining & AI Data Centers
Fair Value US$72.52|20.4% undervalued
BL
Community Contributor
Cooling the Champions: The Aussie Tech Behind F1's Victories
Fair Value AU$12.40|38.1% undervalued
TR
Community Contributor