- United States
- /
- Machinery
- /
- NasdaqCM:MNTX
These 4 Measures Indicate That Manitex International (NASDAQ:MNTX) Is Using Debt Extensively

Legendary fund manager Li Lu (who Charlie Munger backed) once said, 'The biggest investment risk is not the volatility of prices, but whether you will suffer a permanent loss of capital.' It's only natural to consider a company's balance sheet when you examine how risky it is, since debt is often involved when a business collapses. As with many other companies Manitex International, Inc. (NASDAQ:MNTX) makes use of debt. But the more important question is: how much risk is that debt creating?
When Is Debt Dangerous?
Debt and other liabilities become risky for a business when it cannot easily fulfill those obligations, either with free cash flow or by raising capital at an attractive price. Ultimately, if the company can't fulfill its legal obligations to repay debt, shareholders could walk away with nothing. However, a more usual (but still expensive) situation is where a company must dilute shareholders at a cheap share price simply to get debt under control. Of course, the upside of debt is that it often represents cheap capital, especially when it replaces dilution in a company with the ability to reinvest at high rates of return. The first step when considering a company's debt levels is to consider its cash and debt together.
Check out our latest analysis for Manitex International
What Is Manitex International's Debt?
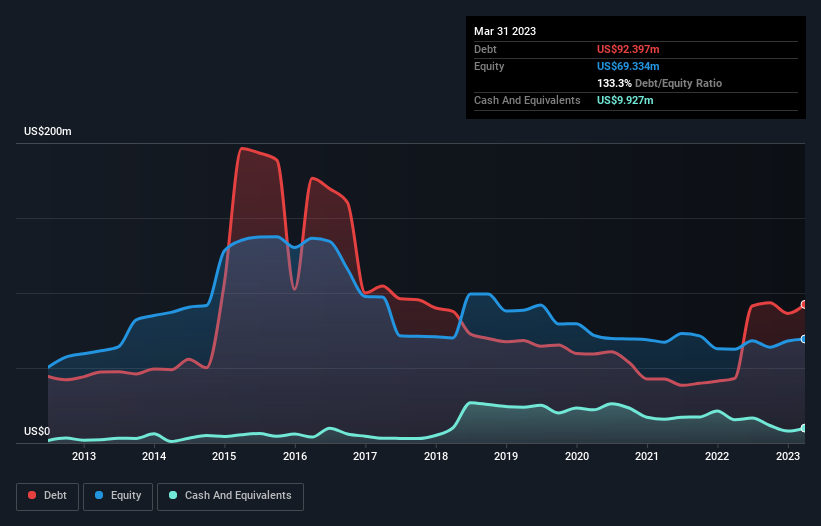
You can click the graphic below for the historical numbers, but it shows that as of March 2023 Manitex International had US$92.4m of debt, an increase on US$43.1m, over one year. On the flip side, it has US$9.93m in cash leading to net debt of about US$82.5m.

A Look At Manitex International's Liabilities
The latest balance sheet data shows that Manitex International had liabilities of US$88.9m due within a year, and liabilities of US$91.0m falling due after that. On the other hand, it had cash of US$9.93m and US$45.2m worth of receivables due within a year. So its liabilities total US$124.8m more than the combination of its cash and short-term receivables.
When you consider that this deficiency exceeds the company's US$101.6m market capitalization, you might well be inclined to review the balance sheet intently. In the scenario where the company had to clean up its balance sheet quickly, it seems likely shareholders would suffer extensive dilution.
In order to size up a company's debt relative to its earnings, we calculate its net debt divided by its earnings before interest, tax, depreciation, and amortization (EBITDA) and its earnings before interest and tax (EBIT) divided by its interest expense (its interest cover). This way, we consider both the absolute quantum of the debt, as well as the interest rates paid on it.
While Manitex International's debt to EBITDA ratio (3.9) suggests that it uses some debt, its interest cover is very weak, at 1.7, suggesting high leverage. In large part that's due to the company's significant depreciation and amortisation charges, which arguably mean its EBITDA is a very generous measure of earnings, and its debt may be more of a burden than it first appears. It seems clear that the cost of borrowing money is negatively impacting returns for shareholders, of late. The silver lining is that Manitex International grew its EBIT by 690% last year, which nourishing like the idealism of youth. If it can keep walking that path it will be in a position to shed its debt with relative ease. There's no doubt that we learn most about debt from the balance sheet. But it is future earnings, more than anything, that will determine Manitex International's ability to maintain a healthy balance sheet going forward. So if you're focused on the future you can check out this free report showing analyst profit forecasts.
Finally, a company can only pay off debt with cold hard cash, not accounting profits. So it's worth checking how much of that EBIT is backed by free cash flow. Over the last two years, Manitex International saw substantial negative free cash flow, in total. While that may be a result of expenditure for growth, it does make the debt far more risky.
Our View
To be frank both Manitex International's interest cover and its track record of converting EBIT to free cash flow make us rather uncomfortable with its debt levels. But on the bright side, its EBIT growth rate is a good sign, and makes us more optimistic. Overall, it seems to us that Manitex International's balance sheet is really quite a risk to the business. So we're almost as wary of this stock as a hungry kitten is about falling into its owner's fish pond: once bitten, twice shy, as they say. The balance sheet is clearly the area to focus on when you are analysing debt. But ultimately, every company can contain risks that exist outside of the balance sheet. For example, we've discovered 1 warning sign for Manitex International that you should be aware of before investing here.
Of course, if you're the type of investor who prefers buying stocks without the burden of debt, then don't hesitate to discover our exclusive list of net cash growth stocks, today.
New: Manage All Your Stock Portfolios in One Place
We've created the ultimate portfolio companion for stock investors, and it's free.
• Connect an unlimited number of Portfolios and see your total in one currency
• Be alerted to new Warning Signs or Risks via email or mobile
• Track the Fair Value of your stocks
Have feedback on this article? Concerned about the content? Get in touch with us directly. Alternatively, email editorial-team (at) simplywallst.com.
This article by Simply Wall St is general in nature. We provide commentary based on historical data and analyst forecasts only using an unbiased methodology and our articles are not intended to be financial advice. It does not constitute a recommendation to buy or sell any stock, and does not take account of your objectives, or your financial situation. We aim to bring you long-term focused analysis driven by fundamental data. Note that our analysis may not factor in the latest price-sensitive company announcements or qualitative material. Simply Wall St has no position in any stocks mentioned.
About NasdaqCM:MNTX
Manitex International
Provides engineered lifting solutions in the United States, Italy, Canada, Chile, France, and internationally.
Solid track record and good value.

