Legence (LGN) shares have moved higher recently, catching investors’ attention after the company reported a strong annual net income improvement and steady revenue growth. The stock is up more than 20% over the past month.
Legence’s 1-month share price return of 20.2% is grabbing attention, especially after its annual profit surge. Momentum appears to be building as confidence returns and investors increasingly factor in the company’s growth story. With the share price now at $40.27, year-to-date gains are piling up.
With Legence’s powerful performance now commanding the spotlight, the key question for investors is clear: is there still value left to unlock here, or have markets already priced in all of the company’s future growth?
Advertisement
Price-to-Sales of 1.1x: Is it justified?
Legence trades at a price-to-sales (P/S) ratio of 1.1x, while peers in its sector average 2.1x. With the stock closing at $40.27, the current pricing appears low compared to competitors.
The price-to-sales ratio reflects how much investors are willing to pay for each dollar of the company’s revenue. For construction and capital goods firms, this multiple is important because profits can be volatile, so sales are a more stable valuation anchor.
Legence’s P/S ratio suggests investors are valuing its revenue stream much more conservatively than those of peer companies. This could indicate potential market skepticism regarding profitability, growth prospects, or recent volatility. Despite 19.3% revenue growth last year and forecasts for faster-than-market revenue gains, the market has not priced Legence at a premium.
Compared to the US Construction industry average of 1.3x, Legence is below the average. This could signal a disconnect between recent company performance and market sentiment. Should expectations shift or execution improve, there may be room for the valuation to align more closely with sector norms.
Another View: SWS DCF Model Offers a Different Take
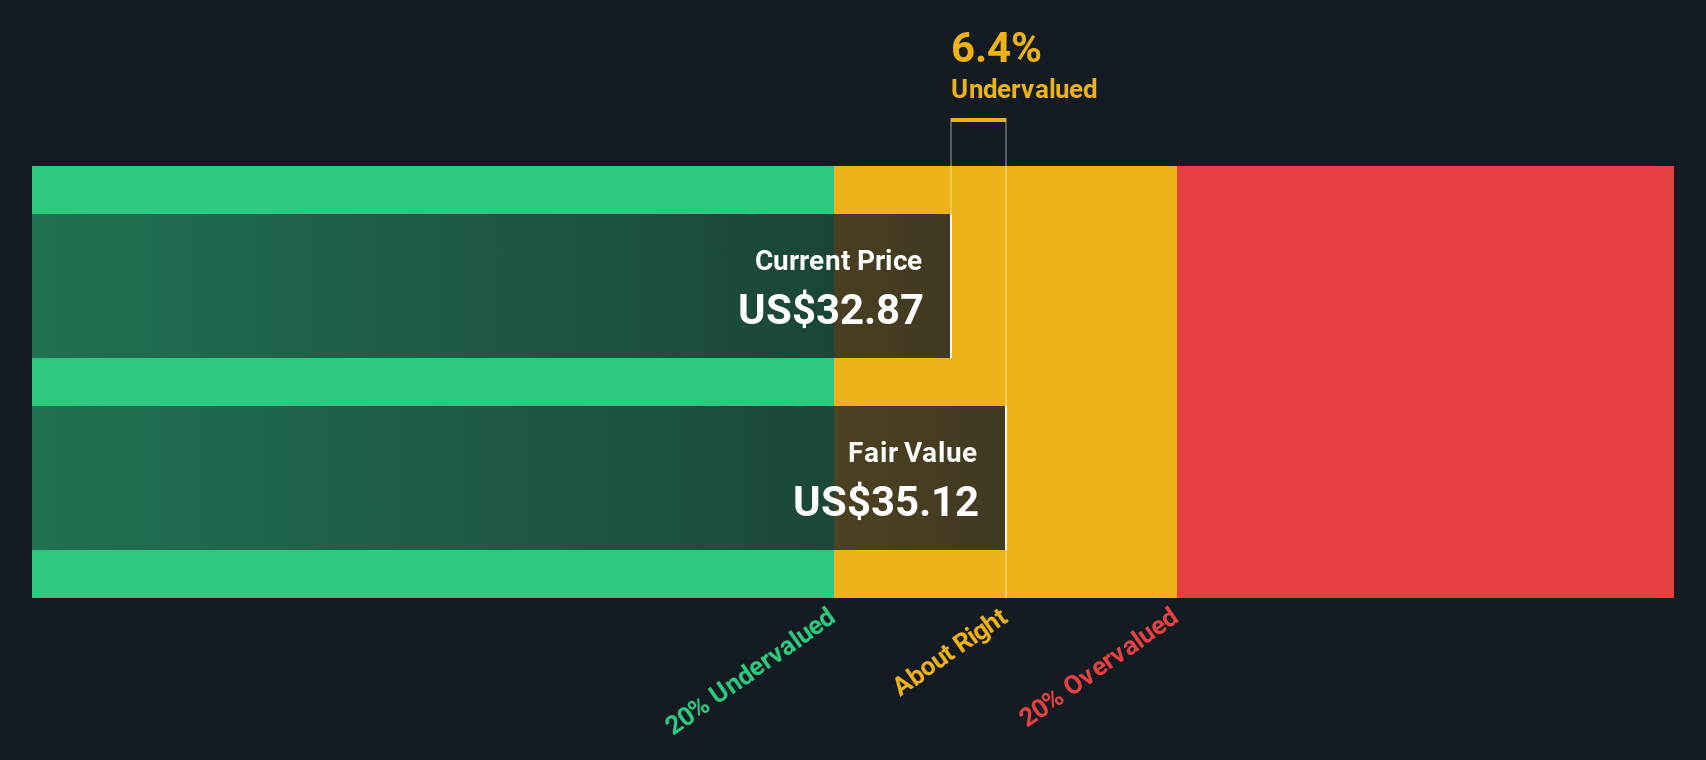
While Legence looks undervalued on its price-to-sales ratio, our DCF model comes to a different conclusion. It suggests the stock is currently trading above our estimate of fair value. This could mean the market is already optimistic about future growth. So which perspective deserves more weight?
Simply Wall St performs a discounted cash flow (DCF) on every stock in the world every day (check out Legence for example). We show the entire calculation in full. You can track the result in your watchlist or portfolio and be alerted when this changes, or use our stock screener to discover 879 undervalued stocks based on their cash flows. If you save a screener we even alert you when new companies match - so you never miss a potential opportunity.
Build Your Own Legence Narrative
If you see things differently or want to dig deeper into the numbers on your own, you can shape a personalized view in just a few minutes with Do it your way.
Don't let opportunity slip by when so many exciting stocks are gaining momentum. Supercharge your watchlist with these handpicked screens that spotlight real trends and potential breakout leaders.
Capitalize on the explosive growth of the sector by targeting these 25 AI penny stocks at the forefront of artificial intelligence innovation.
Ride the wave of next-level digital finance by tapping into these 82 cryptocurrency and blockchain stocks that are pushing blockchain, cryptocurrency adoption, and payment technologies forward.
This article by Simply Wall St is general in nature. We provide commentary based on historical data
and analyst forecasts only using an unbiased methodology and our articles are not intended to be financial advice. It does not constitute a recommendation to buy or sell any stock, and does not take account of your objectives, or your
financial situation. We aim to bring you long-term focused analysis driven by fundamental data.
Note that our analysis may not factor in the latest price-sensitive company announcements or qualitative material.
Simply Wall St has no position in any stocks mentioned.
New: AI Stock Screener & Alerts
Our new AI Stock Screener scans the market every day to uncover opportunities.
• Dividend Powerhouses (3%+ Yield) • Undervalued Small Caps with Insider Buying • High growth Tech and AI Companies