Advertisement
- United States
- /
- Aerospace & Defense
- /
- NasdaqCM:BYRN
Is Byrna Technologies a Growth Opportunity After Its 58% Rally and New Product Launches?

Simply Wall St
Reviewed by Bailey Pemberton
If you have been watching Byrna Technologies and wondering whether now is the moment to get in, you are not alone. The stock has been catching flurries of attention from investors searching for overlooked growth stories with real staying power. Over the past month, Byrna’s share price climbed 12.6%, and the one-year return sits at an impressive 58.2%. If you zoom out even further, the three-year gain of 268.9% stands out, especially considering the more recent volatility and a year-to-date dip of nearly 20%.
So, what is driving this blend of long-term growth and recent pullback? Much of it reflects a shift in how the market views Byrna’s potential in the non-lethal personal security sector. New product launches and strategic partnerships have helped reinforce its reputation as an innovator. Investor sentiment continues to be shaped by broader discussions around security technology in today’s market climate. The stock’s recent uptick hints at renewed optimism and may indicate that investors are reassessing Byrna’s growth story and risk profile.
But what really matters for a long-term investor is whether the stock is actually undervalued when you dig into the numbers. Here is where Byrna gets interesting: based on our value analysis, the company scores a 5 out of 6 on the valuation checklist, meaning it looks undervalued by most measures. In the next section, we will break down these valuation approaches and reveal which models suggest Byrna offers the best opportunity for those looking beyond the headlines.
Approach 1: Byrna Technologies Discounted Cash Flow (DCF) Analysis
The Discounted Cash Flow (DCF) model estimates the true value of a business by projecting its expected future cash flows and discounting them back to today's dollars. This approach helps investors look past price volatility and focus on a company's underlying ability to generate cash in the years ahead.
For Byrna Technologies, the latest reported Free Cash Flow (FCF) stands at -$6.39 Million. Despite this negative starting point, analysts expect strong improvements, projecting FCF of $13.24 Million in 2026 and $19.44 Million in 2027. Projections continue beyond analyst coverage, with Simply Wall St extrapolating FCF to reach $46.95 Million by 2035, using a 2 Stage Free Cash Flow to Equity model.
With this pattern of accelerating growth, the DCF model calculates a fair value per share of $31.54. This is 27.7% higher than Byrna’s recent trading price, which may indicate the stock is currently undervalued from a cash flow perspective.
Result: UNDERVALUED
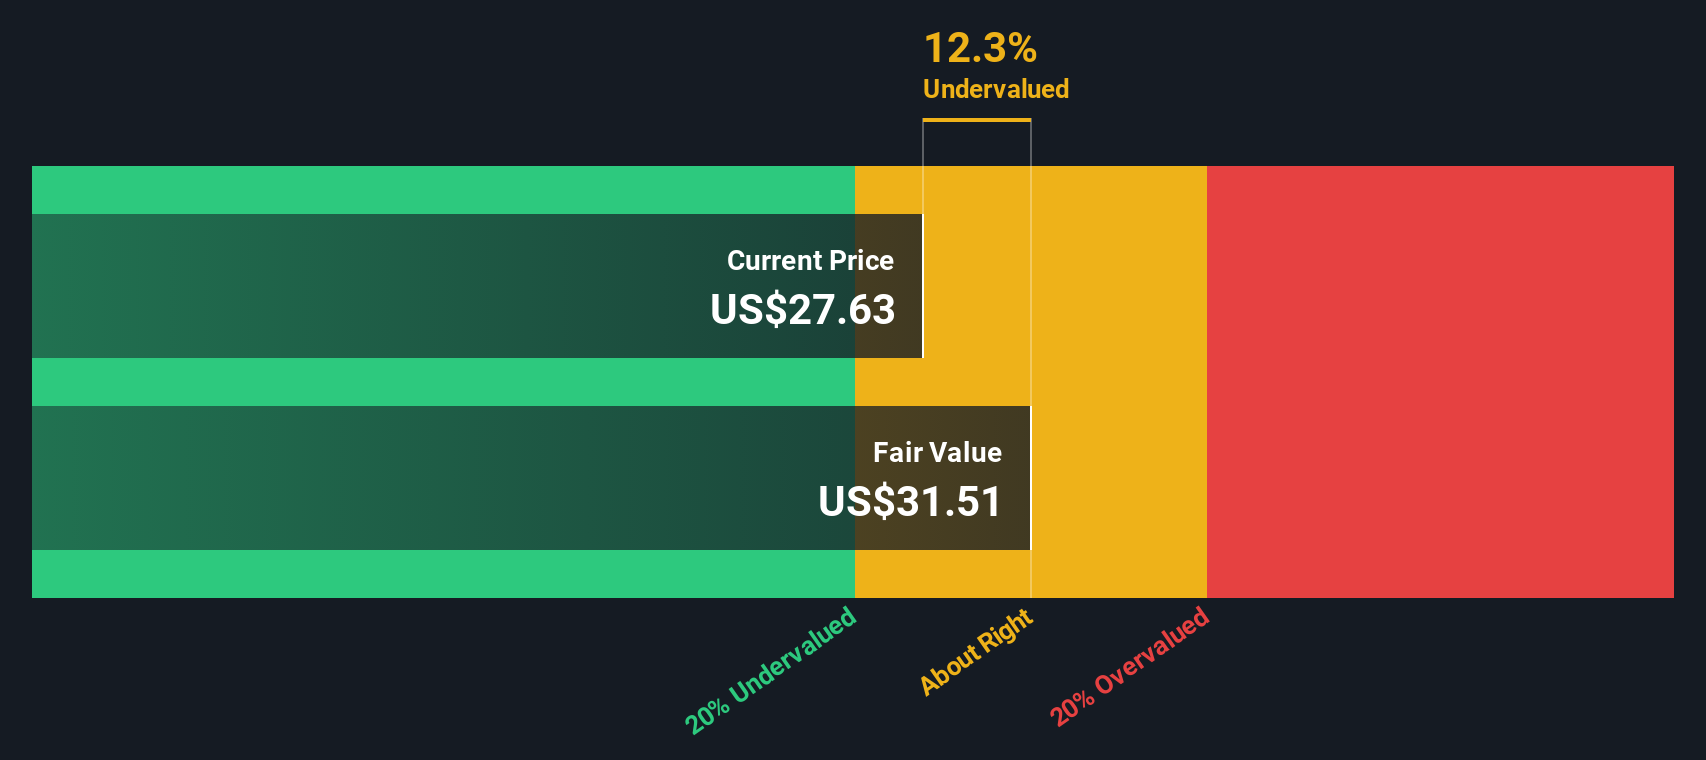
Our Discounted Cash Flow (DCF) analysis suggests Byrna Technologies is undervalued by 27.7%. Track this in your watchlist or portfolio, or discover more undervalued stocks.
Approach 2: Byrna Technologies Price vs Earnings (PE)
The Price-to-Earnings (PE) ratio is commonly used to value profitable companies, because it reflects how much investors are willing to pay for each dollar of earnings. For companies like Byrna Technologies that are generating profits, the PE ratio captures both the company's current profitability and market expectations for continued growth.
A "normal" or "fair" PE ratio varies depending on a company’s earnings growth outlook, risk profile, and industry conditions. Higher expected growth and lower risks often justify a higher PE, while slow growth or additional risks tend to pull the multiple lower.
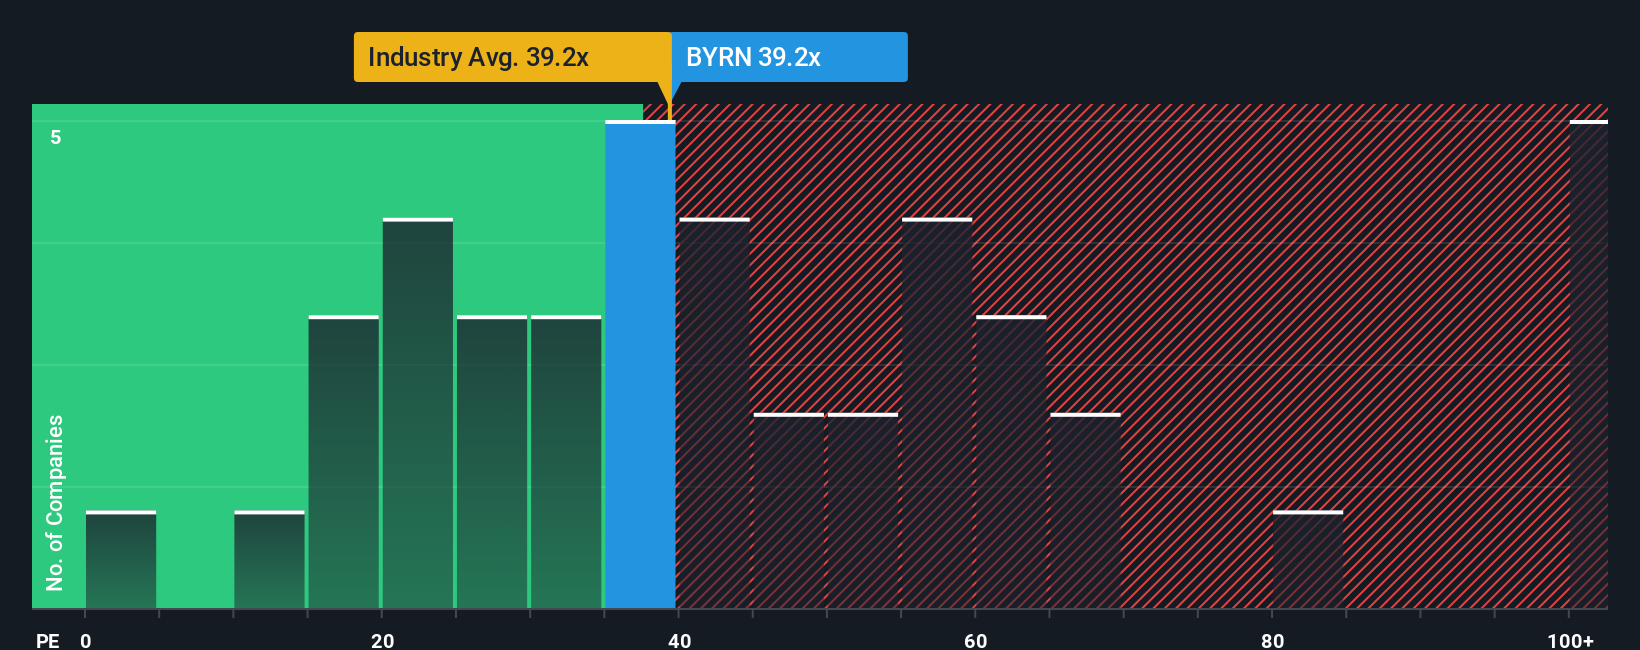
Byrna’s current PE stands at 35x, almost exactly aligned with the peer average of 35x and just below the Aerospace & Defense industry average of 39x. However, Simply Wall St’s proprietary “Fair Ratio” for Byrna is calculated at 39x. This fair PE takes into account not only peer and industry metrics but also Byrna’s unique combination of growth potential, profit margin, risk factors, and market cap. This provides a more nuanced benchmark than simple peer comparison.
Given that Byrna’s actual PE is just under its fair ratio, the stock appears to be valued about right based on this approach.
Result: ABOUT RIGHT
PE ratios tell one story, but what if the real opportunity lies elsewhere? Discover companies where insiders are betting big on explosive growth.
Upgrade Your Decision Making: Choose your Byrna Technologies Narrative
Earlier we mentioned that there is an even better way to understand valuation, so let's introduce you to Narratives. Rather than focusing solely on ratios or price targets, Narratives allow you to create and follow a story that connects your personal perspective on Byrna Technologies to the financial forecasts and fair value you believe are realistic.
A Narrative is simply your view of the business, combining your assumptions about future revenue, earnings, and profit margins to explain why you think the company should be worth a particular amount. Narratives link the qualitative story (what’s happening with Byrna’s products, partnerships, and strategy) to a clear financial forecast, which then drives a fair value estimate. This approach helps you see valuation as more than just a number, grounding your investment decision in logic and context.
On Simply Wall St’s Community page, millions of investors use Narratives as an easy and accessible tool to map their outlook against actual market data. With Narratives, you can quickly compare your Fair Value to the current stock price and decide if it is time to buy, hold, or sell. In addition, your Narrative is updated automatically whenever fresh information, like earnings or major news, becomes available, so your view is always current.
For example, some investors may believe Byrna’s rapid new product launches and expanding partnerships justify a price target of $46.0, while more cautious investors, factoring in rising supply chain costs and competitive pressures, might see fair value closer to $35.0.
Do you think there's more to the story for Byrna Technologies? Create your own Narrative to let the Community know!

This article by Simply Wall St is general in nature. We provide commentary based on historical data and analyst forecasts only using an unbiased methodology and our articles are not intended to be financial advice. It does not constitute a recommendation to buy or sell any stock, and does not take account of your objectives, or your financial situation. We aim to bring you long-term focused analysis driven by fundamental data. Note that our analysis may not factor in the latest price-sensitive company announcements or qualitative material. Simply Wall St has no position in any stocks mentioned.
Valuation is complex, but we're here to simplify it.
Discover if Byrna Technologies might be undervalued or overvalued with our detailed analysis, featuring fair value estimates, potential risks, dividends, insider trades, and its financial condition.
Access Free AnalysisHave feedback on this article? Concerned about the content? Get in touch with us directly. Alternatively, email editorial-team@simplywallst.com
About NasdaqCM:BYRN
Byrna Technologies
A less-lethal self-defense technology company, develops, manufactures, and sells less-lethal personal security solutions in the United States, South Africa, Europe, South America, Asia, and Canada.
Flawless balance sheet and undervalued.
Similar Companies
Market Insights

Advertisement
Community Narratives
A formidable player in AI and enterprise computing.
Fair Value US$210.00|12.2% overvalued
CO
Community Contributor
IREN's Bold Moves in Sustainable Bitcoin Mining & AI Data Centers
Fair Value US$72.52|17.1% undervalued
BL
Community Contributor
Cooling the Champions: The Aussie Tech Behind F1's Victories
Fair Value AU$12.40|38.7% undervalued
TR
Community Contributor