Stock Analysis
- United States
- /
- Banks
- /
- NYSE:CMA
Comerica (NYSE:CMA) sheds US$681m, company earnings and investor returns have been trending downwards for past five years


In order to justify the effort of selecting individual stocks, it's worth striving to beat the returns from a market index fund. But in any portfolio, there will be mixed results between individual stocks. So we wouldn't blame long term Comerica Incorporated (NYSE:CMA) shareholders for doubting their decision to hold, with the stock down 31% over a half decade. And the share price decline continued over the last week, dropping some 9.3%.
If the past week is anything to go by, investor sentiment for Comerica isn't positive, so let's see if there's a mismatch between fundamentals and the share price.
Check out our latest analysis for Comerica
While markets are a powerful pricing mechanism, share prices reflect investor sentiment, not just underlying business performance. By comparing earnings per share (EPS) and share price changes over time, we can get a feel for how investor attitudes to a company have morphed over time.
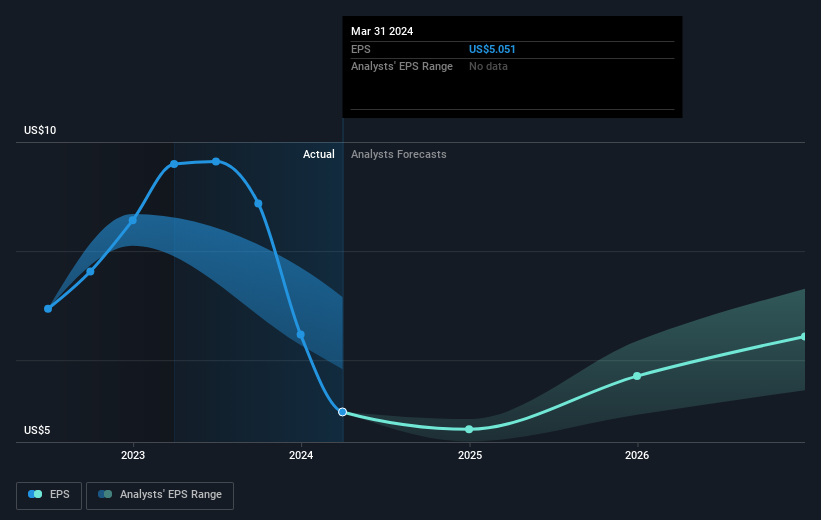
During the five years over which the share price declined, Comerica's earnings per share (EPS) dropped by 8.4% each year. This change in EPS is reasonably close to the 7% average annual decrease in the share price. This suggests that market participants have not changed their view of the company all that much. Rather, the share price change has reflected changes in earnings per share.
You can see how EPS has changed over time in the image below (click on the chart to see the exact values).
Before buying or selling a stock, we always recommend a close examination of historic growth trends, available here.
What About Dividends?
It is important to consider the total shareholder return, as well as the share price return, for any given stock. The TSR incorporates the value of any spin-offs or discounted capital raisings, along with any dividends, based on the assumption that the dividends are reinvested. So for companies that pay a generous dividend, the TSR is often a lot higher than the share price return. We note that for Comerica the TSR over the last 5 years was -11%, which is better than the share price return mentioned above. And there's no prize for guessing that the dividend payments largely explain the divergence!
A Different Perspective
Comerica provided a TSR of 5.3% over the last twelve months. But that was short of the market average. On the bright side, that's still a gain, and it is certainly better than the yearly loss of about 2% endured over half a decade. It could well be that the business is stabilizing. I find it very interesting to look at share price over the long term as a proxy for business performance. But to truly gain insight, we need to consider other information, too. Case in point: We've spotted 2 warning signs for Comerica you should be aware of.
For those who like to find winning investments this free list of undervalued companies with recent insider purchasing, could be just the ticket.
Please note, the market returns quoted in this article reflect the market weighted average returns of stocks that currently trade on American exchanges.
Valuation is complex, but we're helping make it simple.
Find out whether Comerica is potentially over or undervalued by checking out our comprehensive analysis, which includes fair value estimates, risks and warnings, dividends, insider transactions and financial health.
View the Free AnalysisHave feedback on this article? Concerned about the content? Get in touch with us directly. Alternatively, email editorial-team (at) simplywallst.com.
This article by Simply Wall St is general in nature. We provide commentary based on historical data and analyst forecasts only using an unbiased methodology and our articles are not intended to be financial advice. It does not constitute a recommendation to buy or sell any stock, and does not take account of your objectives, or your financial situation. We aim to bring you long-term focused analysis driven by fundamental data. Note that our analysis may not factor in the latest price-sensitive company announcements or qualitative material. Simply Wall St has no position in any stocks mentioned.
Valuation is complex, but we're helping make it simple.
Find out whether Comerica is potentially over or undervalued by checking out our comprehensive analysis, which includes fair value estimates, risks and warnings, dividends, insider transactions and financial health.
View the Free AnalysisHave feedback on this article? Concerned about the content? Get in touch with us directly. Alternatively, email editorial-team@simplywallst.com
About NYSE:CMA
Comerica
Through its subsidiaries, provides various financial products and services.
Flawless balance sheet 6 star dividend payer.
