Advertisement
- United States
- /
- Banks
- /
- NasdaqGS:ONB
Is There Now an Opportunity in Old National Bancorp After 6% Weekly Rally?

Simply Wall St
Reviewed by Bailey Pemberton
If you are weighing your next move with Old National Bancorp, you are certainly not alone. Investors are taking note as this regional bank’s stock has delivered a rollercoaster of returns lately. In just the past week, shares have climbed 6.0%, a sharp turnaround from last month’s dip of almost 5%. With a strong 15.4% return over the last year and an impressive 76.6% gain across five years, Old National has shown that its long-term story is anything but boring.
What is driving these swings? While Old National hasn’t made headlines with blockbuster announcements, its sector has been in the spotlight, with shifting market confidence in the stability of regional banks. Recent news about greater regulatory scrutiny has prompted some investors to reassess risk, but at the same time, Old National has benefited from an improving environment for deposit growth and expanding regional footprints, both of which can shift perceptions fast.
Now, when it comes to valuation, Old National earns a 4 out of 6 on our value score, signaling that the stock remains attractively priced under most traditional measures. But is this the whole picture? Let’s break down how this score is calculated, explore what it means for your money, and later in the article consider a smarter perspective on what valuation really means for long-term investors.
Why Old National Bancorp is lagging behind its peers
Approach 1: Old National Bancorp Excess Returns Analysis
The Excess Returns valuation model examines how effectively Old National Bancorp generates profits above its expected cost of equity. This method focuses on the company’s ability to deliver returns on invested capital beyond what shareholders require, rather than just cash flow or dividend growth.
For Old National Bancorp, the average return on equity is 10.89%. Analysts expect a stable earnings per share of $2.54, based on projections from seven experts. With a book value per share of $20.64 and a cost of equity at $1.72 per share, the company is estimated to generate an excess return of $0.81 per share. Looking ahead, analysts project a stable book value of $23.28 per share, reflecting continued strength in the underlying business.
Bringing these factors together, the model calculates an estimated intrinsic value per share of $42.09. With shares currently trading at a roughly 50% discount to this value, the stock is considered significantly undervalued by this metric.
Result: UNDERVALUED
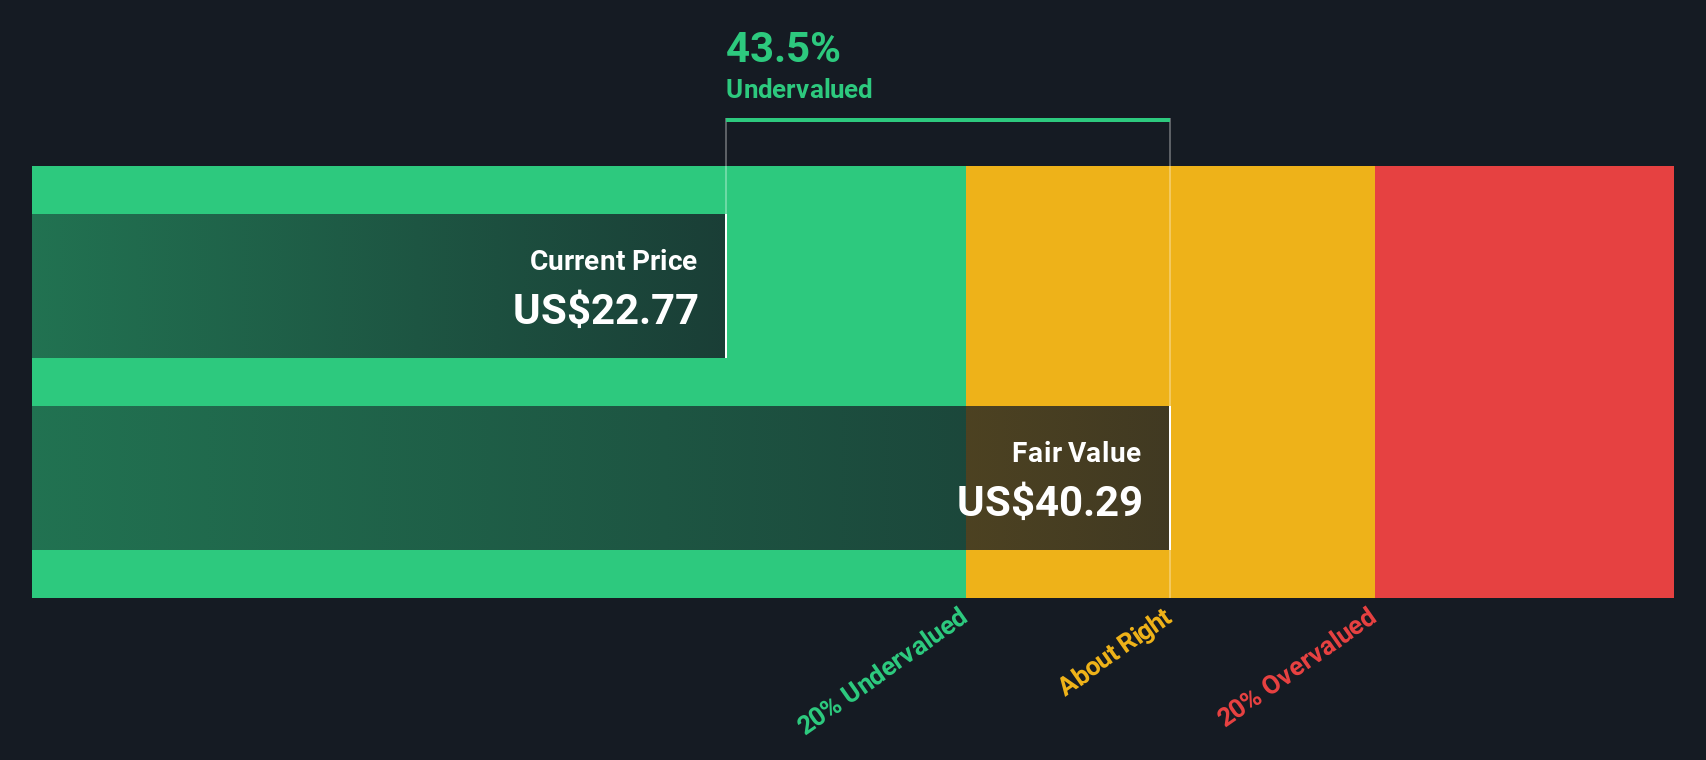
Our Excess Returns analysis suggests Old National Bancorp is undervalued by 50.0%. Track this in your watchlist or portfolio, or discover more undervalued stocks.
Approach 2: Old National Bancorp Price vs Earnings
For profitable companies like Old National Bancorp, the price-to-earnings (PE) ratio is a trusted valuation measure because it directly connects a company’s share price to its earnings power. It tells investors how much they are paying for each dollar of earnings, making it especially relevant for mature, steady profit generators.
A “normal” or “fair” PE ratio is not just pulled from the air; it depends on an array of factors including expected earnings growth, profit margins, and company-specific risks. Generally, companies with higher expected growth or lower risk tend to command higher PE ratios, while those in more mature or riskier segments trade at a discount.
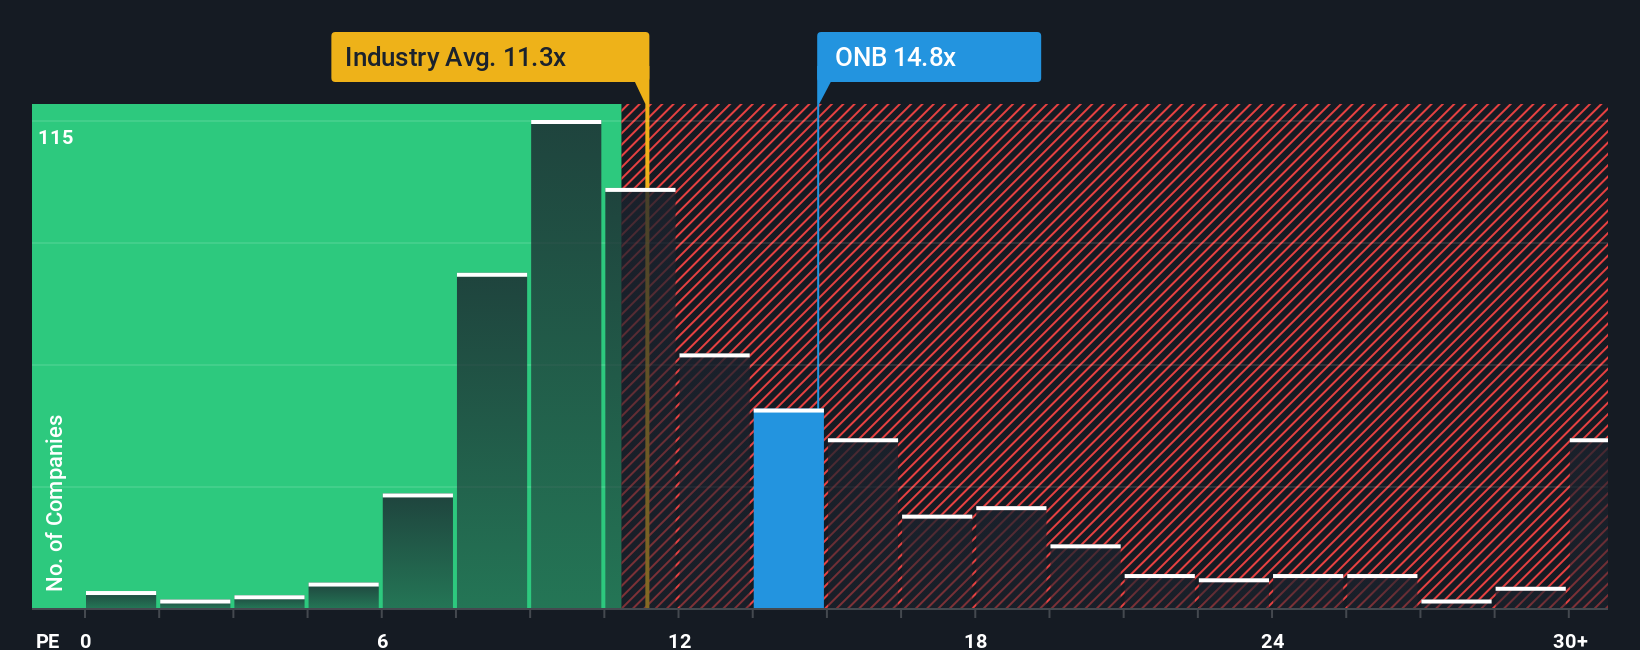
Old National currently trades at a PE ratio of 13.9x. By comparison, the average bank in its industry trades at 11.2x, while its direct peers sit around 12.8x. At first glance, this suggests Old National commands a modest premium, which may reflect stronger fundamentals or outlook versus many peers.
However, the “Fair Ratio” calculated by Simply Wall St for Old National is 17.8x. This proprietary metric improves on simple peer or industry comparisons by layering in the company’s expected future earnings growth, profit margins, industry classification, market cap, and risk profile. In essence, it provides a custom benchmark for what investors should reasonably pay for Old National’s earnings today.
With a current PE ratio of 13.9x versus a Fair Ratio of 17.8x, Old National Bancorp is trading below what would be considered “fair value” by this model. This points to an opportunity for value-oriented investors.
Result: UNDERVALUED
PE ratios tell one story, but what if the real opportunity lies elsewhere? Discover companies where insiders are betting big on explosive growth.
Upgrade Your Decision Making: Choose your Old National Bancorp Narrative
Earlier, we mentioned there is a more powerful way to approach valuation than simply relying on traditional metrics, so let’s introduce you to Narratives. A Narrative is a story you create about a company like Old National Bancorp by combining your expectations for future revenue, earnings, and risk alongside today’s fair value. It bridges the gap between what the numbers say and what you believe will drive the company forward.
On Simply Wall St’s platform, Narratives are easy for anyone to build or explore in the Community page, where millions of investors share their perspectives. Narratives connect your view of Old National’s strategy and prospects to a detailed forecast and then to a dynamic fair value, making it a practical guide for deciding when to buy or sell as price and outlook evolve. Importantly, your Narrative updates automatically when fresh news or earnings land, ensuring you stay contextually informed.
For example, one investor might see Old National’s digital investments and acquisitive growth and set a target price near the recent analyst fair value of $26.45. Another, more cautious investor with lower revenue assumptions and concerns about commercial real estate, might estimate a fair value as low as $22.30. These are different stories, different forecasts, and different actions, all driven by their personal Narrative.
Do you think there's more to the story for Old National Bancorp? Create your own Narrative to let the Community know!

This article by Simply Wall St is general in nature. We provide commentary based on historical data and analyst forecasts only using an unbiased methodology and our articles are not intended to be financial advice. It does not constitute a recommendation to buy or sell any stock, and does not take account of your objectives, or your financial situation. We aim to bring you long-term focused analysis driven by fundamental data. Note that our analysis may not factor in the latest price-sensitive company announcements or qualitative material. Simply Wall St has no position in any stocks mentioned.
New: AI Stock Screener & Alerts
Our new AI Stock Screener scans the market every day to uncover opportunities.
• Dividend Powerhouses (3%+ Yield)
• Undervalued Small Caps with Insider Buying
• High growth Tech and AI Companies
Or build your own from over 50 metrics.
Have feedback on this article? Concerned about the content? Get in touch with us directly. Alternatively, email editorial-team@simplywallst.com
About NasdaqGS:ONB
Old National Bancorp
Operates as the bank holding company for Old National Bank that provides consumer and commercial banking services in the United States.
Excellent balance sheet established dividend payer.
Similar Companies
Market Insights

Advertisement
Community Narratives
Finding The True Value Of A Logistics Powerhouse
Fair Value US$95.21|8.4% undervalued
NV
Community Contributor
Paradigm Biopharmaceuticals Will Lead Osteoarthritis Treatment with Zilosul's FDA Success
Fair Value AU$5.50|92.1% undervalued
AM
Community Contributor
Barrick Mining (ABX:CA): A Gold Hedge against a U.S. Shutdown
Fair Value CA$60.00|24.2% undervalued
GM
Community Contributor