- United States
- /
- Banks
- /
- NasdaqGS:FISI
How Much Did Financial Institutions'(NASDAQ:FISI) Shareholders Earn From Share Price Movements Over The Last Three Years?


While it may not be enough for some shareholders, we think it is good to see the Financial Institutions, Inc. (NASDAQ:FISI) share price up 26% in a single quarter. But that cannot eclipse the less-than-impressive returns over the last three years. After all, the share price is down 17% in the last three years, significantly under-performing the market.
View our latest analysis for Financial Institutions
In his essay The Superinvestors of Graham-and-Doddsville Warren Buffett described how share prices do not always rationally reflect the value of a business. By comparing earnings per share (EPS) and share price changes over time, we can get a feel for how investor attitudes to a company have morphed over time.
During the unfortunate three years of share price decline, Financial Institutions actually saw its earnings per share (EPS) improve by 2.6% per year. This is quite a puzzle, and suggests there might be something temporarily buoying the share price. Alternatively, growth expectations may have been unreasonable in the past.
After considering the numbers, we'd posit that the the market had higher expectations of EPS growth, three years back. Looking to other metrics might better explain the share price change.
Given the healthiness of the dividend payments, we doubt that they've concerned the market. We like that Financial Institutions has actually grown its revenue over the last three years. But it's not clear to us why the share price is down. It might be worth diving deeper into the fundamentals, lest an opportunity goes begging.
You can see below how earnings and revenue have changed over time (discover the exact values by clicking on the image).
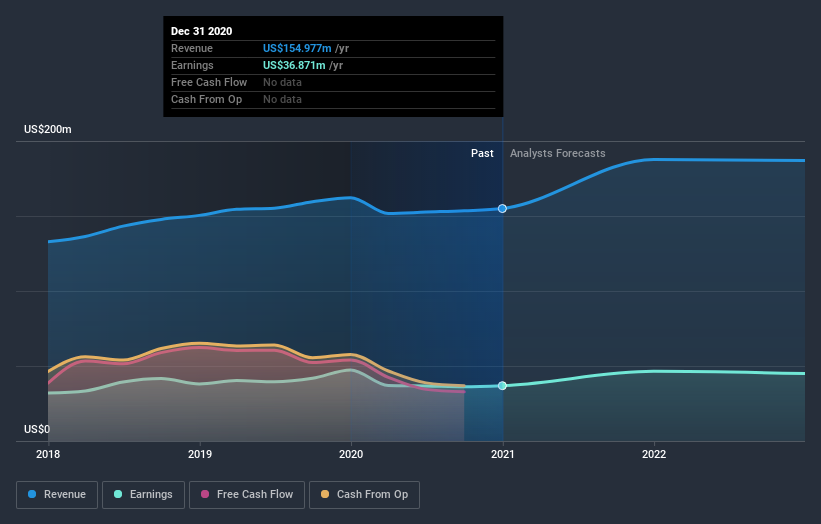
We like that insiders have been buying shares in the last twelve months. Having said that, most people consider earnings and revenue growth trends to be a more meaningful guide to the business. You can see what analysts are predicting for Financial Institutions in this interactive graph of future profit estimates.
What About Dividends?
When looking at investment returns, it is important to consider the difference between total shareholder return (TSR) and share price return. Whereas the share price return only reflects the change in the share price, the TSR includes the value of dividends (assuming they were reinvested) and the benefit of any discounted capital raising or spin-off. Arguably, the TSR gives a more comprehensive picture of the return generated by a stock. In the case of Financial Institutions, it has a TSR of -6.0% for the last 3 years. That exceeds its share price return that we previously mentioned. And there's no prize for guessing that the dividend payments largely explain the divergence!
A Different Perspective
Investors in Financial Institutions had a tough year, with a total loss of 10% (including dividends), against a market gain of about 28%. However, keep in mind that even the best stocks will sometimes underperform the market over a twelve month period. Longer term investors wouldn't be so upset, since they would have made 3%, each year, over five years. It could be that the recent sell-off is an opportunity, so it may be worth checking the fundamental data for signs of a long term growth trend. I find it very interesting to look at share price over the long term as a proxy for business performance. But to truly gain insight, we need to consider other information, too. Take risks, for example - Financial Institutions has 2 warning signs we think you should be aware of.
There are plenty of other companies that have insiders buying up shares. You probably do not want to miss this free list of growing companies that insiders are buying.
Please note, the market returns quoted in this article reflect the market weighted average returns of stocks that currently trade on US exchanges.
If you decide to trade Financial Institutions, use the lowest-cost* platform that is rated #1 Overall by Barron’s, Interactive Brokers. Trade stocks, options, futures, forex, bonds and funds on 135 markets, all from a single integrated account. Promoted
New: AI Stock Screener & Alerts
Our new AI Stock Screener scans the market every day to uncover opportunities.
• Dividend Powerhouses (3%+ Yield)
• Undervalued Small Caps with Insider Buying
• High growth Tech and AI Companies
Or build your own from over 50 metrics.
This article by Simply Wall St is general in nature. It does not constitute a recommendation to buy or sell any stock, and does not take account of your objectives, or your financial situation. We aim to bring you long-term focused analysis driven by fundamental data. Note that our analysis may not factor in the latest price-sensitive company announcements or qualitative material. Simply Wall St has no position in any stocks mentioned.
*Interactive Brokers Rated Lowest Cost Broker by StockBrokers.com Annual Online Review 2020
Have feedback on this article? Concerned about the content? Get in touch with us directly. Alternatively, email editorial-team (at) simplywallst.com.
About NasdaqGS:FISI
Financial Institutions
Operates as a holding company for the Five Star Bank, a chartered bank that provides banking and financial services to individuals, municipalities, and businesses in New York.
Flawless balance sheet, undervalued and pays a dividend.

