
Advertisement
- United States
- /
- Auto
- /
- NYSE:WGO
Winnebago Industries' (NYSE:WGO) three-year total shareholder returns outpace the underlying earnings growth
It might be of some concern to shareholders to see the Winnebago Industries, Inc. (NYSE:WGO) share price down 15% in the last month. In contrast, the return over three years has been impressive. In three years the stock price has launched 180% higher: a great result. It's not uncommon to see a share price retrace a bit, after a big gain. If the business can perform well for years to come, then the recent drop could be an opportunity.
Since the long term performance has been good but there's been a recent pullback of 6.9%, let's check if the fundamentals match the share price.
Check out our latest analysis for Winnebago Industries
While markets are a powerful pricing mechanism, share prices reflect investor sentiment, not just underlying business performance. One imperfect but simple way to consider how the market perception of a company has shifted is to compare the change in the earnings per share (EPS) with the share price movement.
Winnebago Industries was able to grow its EPS at 52% per year over three years, sending the share price higher. This EPS growth is higher than the 41% average annual increase in the share price. Therefore, it seems the market has moderated its expectations for growth, somewhat. We'd venture the lowish P/E ratio of 5.00 also reflects the negative sentiment around the stock.
The image below shows how EPS has tracked over time (if you click on the image you can see greater detail).
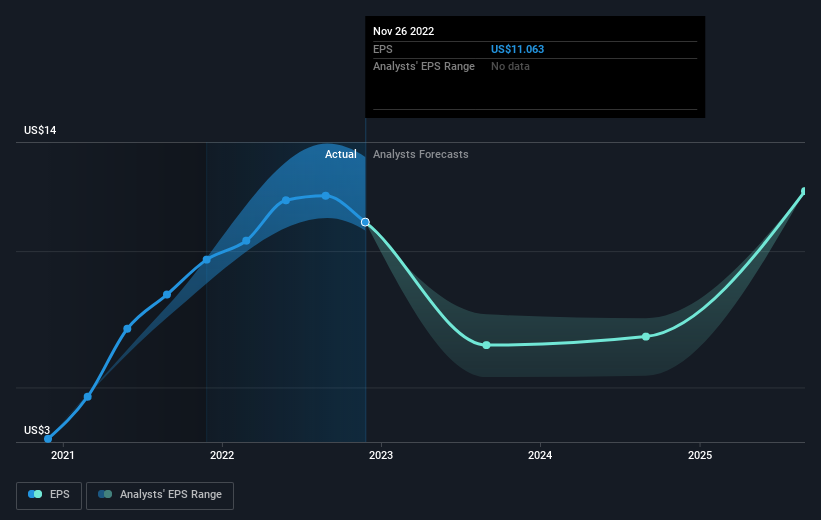
We know that Winnebago Industries has improved its bottom line over the last three years, but what does the future have in store? Take a more thorough look at Winnebago Industries' financial health with this free report on its balance sheet.
What About Dividends?
When looking at investment returns, it is important to consider the difference between total shareholder return (TSR) and share price return. The TSR is a return calculation that accounts for the value of cash dividends (assuming that any dividend received was reinvested) and the calculated value of any discounted capital raisings and spin-offs. It's fair to say that the TSR gives a more complete picture for stocks that pay a dividend. We note that for Winnebago Industries the TSR over the last 3 years was 189%, which is better than the share price return mentioned above. And there's no prize for guessing that the dividend payments largely explain the divergence!
A Different Perspective
Although it hurts that Winnebago Industries returned a loss of 2.4% in the last twelve months, the broader market was actually worse, returning a loss of 10%. Of course, the long term returns are far more important and the good news is that over five years, the stock has returned 8% for each year. In the best case scenario the last year is just a temporary blip on the journey to a brighter future. While it is well worth considering the different impacts that market conditions can have on the share price, there are other factors that are even more important. Even so, be aware that Winnebago Industries is showing 1 warning sign in our investment analysis , you should know about...
If you would prefer to check out another company -- one with potentially superior financials -- then do not miss this free list of companies that have proven they can grow earnings.
Please note, the market returns quoted in this article reflect the market weighted average returns of stocks that currently trade on American exchanges.
Valuation is complex, but we're here to simplify it.
Discover if Winnebago Industries might be undervalued or overvalued with our detailed analysis, featuring fair value estimates, potential risks, dividends, insider trades, and its financial condition.
Access Free AnalysisHave feedback on this article? Concerned about the content? Get in touch with us directly. Alternatively, email editorial-team (at) simplywallst.com.
This article by Simply Wall St is general in nature. We provide commentary based on historical data and analyst forecasts only using an unbiased methodology and our articles are not intended to be financial advice. It does not constitute a recommendation to buy or sell any stock, and does not take account of your objectives, or your financial situation. We aim to bring you long-term focused analysis driven by fundamental data. Note that our analysis may not factor in the latest price-sensitive company announcements or qualitative material. Simply Wall St has no position in any stocks mentioned.
About NYSE:WGO
Winnebago Industries
Manufactures and sells recreation vehicles and marine products primarily for use in leisure travel and outdoor recreation activities.
Adequate balance sheet average dividend payer.
Similar Companies
Market Insights

Advertisement
Community Narratives
Groundbreaking therapies that could change the treatment landscape for PTSD, fibromyalgia, MS & Alzheimer’s
Fair Value US$6.20|82.7% undervalued
CM
Community Contributor
DigitalOcean Will Grow 14% by Embracing AI with Paperspace Acquisition
Fair Value US$50.00|36.8% undervalued
NE
Community Contributor
Viant Technology: A Rising AdTech Challenger in the AI-Powered CTV Market
Fair Value US$38.61|61.4% undervalued
BL
Community Contributor
Volvo will Accelerate Forward into Electric and Autonomous Leadership in Five Years
Fair Value SEK 438.80|37.1% undervalued
UN
Community Contributor