- United States
- /
- Auto
- /
- NasdaqGM:PSNY
Take Care Before Jumping Onto Polestar Automotive Holding UK PLC (NASDAQ:PSNY) Even Though It's 25% Cheaper

Unfortunately for some shareholders, the Polestar Automotive Holding UK PLC (NASDAQ:PSNY) share price has dived 25% in the last thirty days, prolonging recent pain. For any long-term shareholders, the last month ends a year to forget by locking in a 64% share price decline.
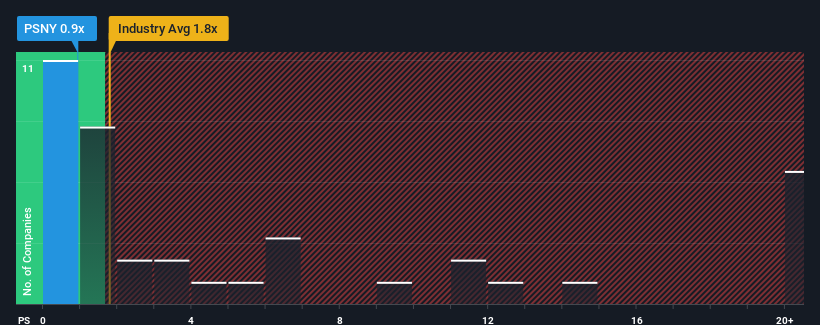
Following the heavy fall in price, Polestar Automotive Holding UK may be sending bullish signals at the moment with its price-to-sales (or "P/S") ratio of 0.9x, since almost half of all companies in the Auto industry in the United States have P/S ratios greater than 1.8x and even P/S higher than 12x are not unusual. Although, it's not wise to just take the P/S at face value as there may be an explanation why it's limited.
View our latest analysis for Polestar Automotive Holding UK
What Does Polestar Automotive Holding UK's Recent Performance Look Like?
Polestar Automotive Holding UK certainly has been doing a good job lately as it's been growing revenue more than most other companies. Perhaps the market is expecting future revenue performance to dive, which has kept the P/S suppressed. If the company manages to stay the course, then investors should be rewarded with a share price that matches its revenue figures.
Keen to find out how analysts think Polestar Automotive Holding UK's future stacks up against the industry? In that case, our free report is a great place to start.Is There Any Revenue Growth Forecasted For Polestar Automotive Holding UK?
The only time you'd be truly comfortable seeing a P/S as low as Polestar Automotive Holding UK's is when the company's growth is on track to lag the industry.
Retrospectively, the last year delivered an exceptional 37% gain to the company's top line. The latest three year period has also seen an incredible overall rise in revenue, aided by its incredible short-term performance. Accordingly, shareholders would have been over the moon with those medium-term rates of revenue growth.
Turning to the outlook, the next three years should generate growth of 62% per annum as estimated by the eight analysts watching the company. With the industry only predicted to deliver 22% each year, the company is positioned for a stronger revenue result.
With this in consideration, we find it intriguing that Polestar Automotive Holding UK's P/S sits behind most of its industry peers. Apparently some shareholders are doubtful of the forecasts and have been accepting significantly lower selling prices.
What We Can Learn From Polestar Automotive Holding UK's P/S?
The southerly movements of Polestar Automotive Holding UK's shares means its P/S is now sitting at a pretty low level. It's argued the price-to-sales ratio is an inferior measure of value within certain industries, but it can be a powerful business sentiment indicator.
To us, it seems Polestar Automotive Holding UK currently trades on a significantly depressed P/S given its forecasted revenue growth is higher than the rest of its industry. There could be some major risk factors that are placing downward pressure on the P/S ratio. While the possibility of the share price plunging seems unlikely due to the high growth forecasted for the company, the market does appear to have some hesitation.
We don't want to rain on the parade too much, but we did also find 4 warning signs for Polestar Automotive Holding UK (2 shouldn't be ignored!) that you need to be mindful of.
If strong companies turning a profit tickle your fancy, then you'll want to check out this free list of interesting companies that trade on a low P/E (but have proven they can grow earnings).
New: Manage All Your Stock Portfolios in One Place
We've created the ultimate portfolio companion for stock investors, and it's free.
• Connect an unlimited number of Portfolios and see your total in one currency
• Be alerted to new Warning Signs or Risks via email or mobile
• Track the Fair Value of your stocks
Have feedback on this article? Concerned about the content? Get in touch with us directly. Alternatively, email editorial-team (at) simplywallst.com.
This article by Simply Wall St is general in nature. We provide commentary based on historical data and analyst forecasts only using an unbiased methodology and our articles are not intended to be financial advice. It does not constitute a recommendation to buy or sell any stock, and does not take account of your objectives, or your financial situation. We aim to bring you long-term focused analysis driven by fundamental data. Note that our analysis may not factor in the latest price-sensitive company announcements or qualitative material. Simply Wall St has no position in any stocks mentioned.
About NasdaqGM:PSNY
Polestar Automotive Holding UK
Manufactures and sells premium electric vehicles.
Fair value low.
Similar Companies
Market Insights

Community Narratives


