Advertisement
- United States
- /
- Auto Components
- /
- NasdaqGS:DORM
Is Dorman Stock Attractive After 10% Slide and Q1 Earnings Beat?

Simply Wall St
Reviewed by Bailey Pemberton
So, you are wondering what to make of Dorman Products stock after its latest moves. Is it the right time to get in, stay put, or rethink your position? You are not alone. Lots of investors are weighing their options as the stock navigates some interesting waters. Over the past week, Dorman shares dipped by 2.6%, and the drop over the last 30 days is even sharper at 9.8%. That might give you pause, but looking further back reveals a much stronger story. The stock is up 14.9% year-to-date, an impressive 35.2% over the last twelve months, and a solid 67.1% return over three years. Even the five-year change, at 57.9%, stands out.
Some of these twists and turns can be traced to broader market sentiment around auto parts suppliers. Ongoing supply chain adjustments and industry innovation have shifted how investors view companies in this segment. These factors add a layer of uncertainty but also hint at growth potential if Dorman can seize new opportunities in the evolving automotive landscape.
If you are focused on value, here is something to consider: Dorman clocks a valuation score of 3, meaning it is considered undervalued in half of the six key checks analysts use. So what do those checks say, and is there another, smarter way to gauge whether Dorman belongs in your portfolio? Let us walk through the valuation approaches and uncover what might really matter in the end.
Approach 1: Dorman Products Discounted Cash Flow (DCF) Analysis
The Discounted Cash Flow (DCF) model works by estimating a company's future cash flows and then discounting them back to the present using a required rate of return. This approach helps investors assess what a company's entire future stream of cash is worth today, making it a useful tool for valuing stocks like Dorman Products.
For Dorman Products, the model uses a two-stage method based on free cash flow to equity. At present, Dorman generated $131.49 million in free cash flow over the last twelve months. Analysts provide solid cash flow estimates for the next five years, with projections reaching $286 million by 2029. For the following years, further increases are extrapolated. By 2035, annual free cash flow could be approaching $389 million, according to these estimates.
When each year’s projected cash flow is discounted back to today, the resulting intrinsic value for Dorman Products comes to $185.28 per share. With shares currently trading at a price about 20.3% below this DCF valuation, the model indicates that Dorman Products stock is undervalued by a comfortable margin.
Result: UNDERVALUED
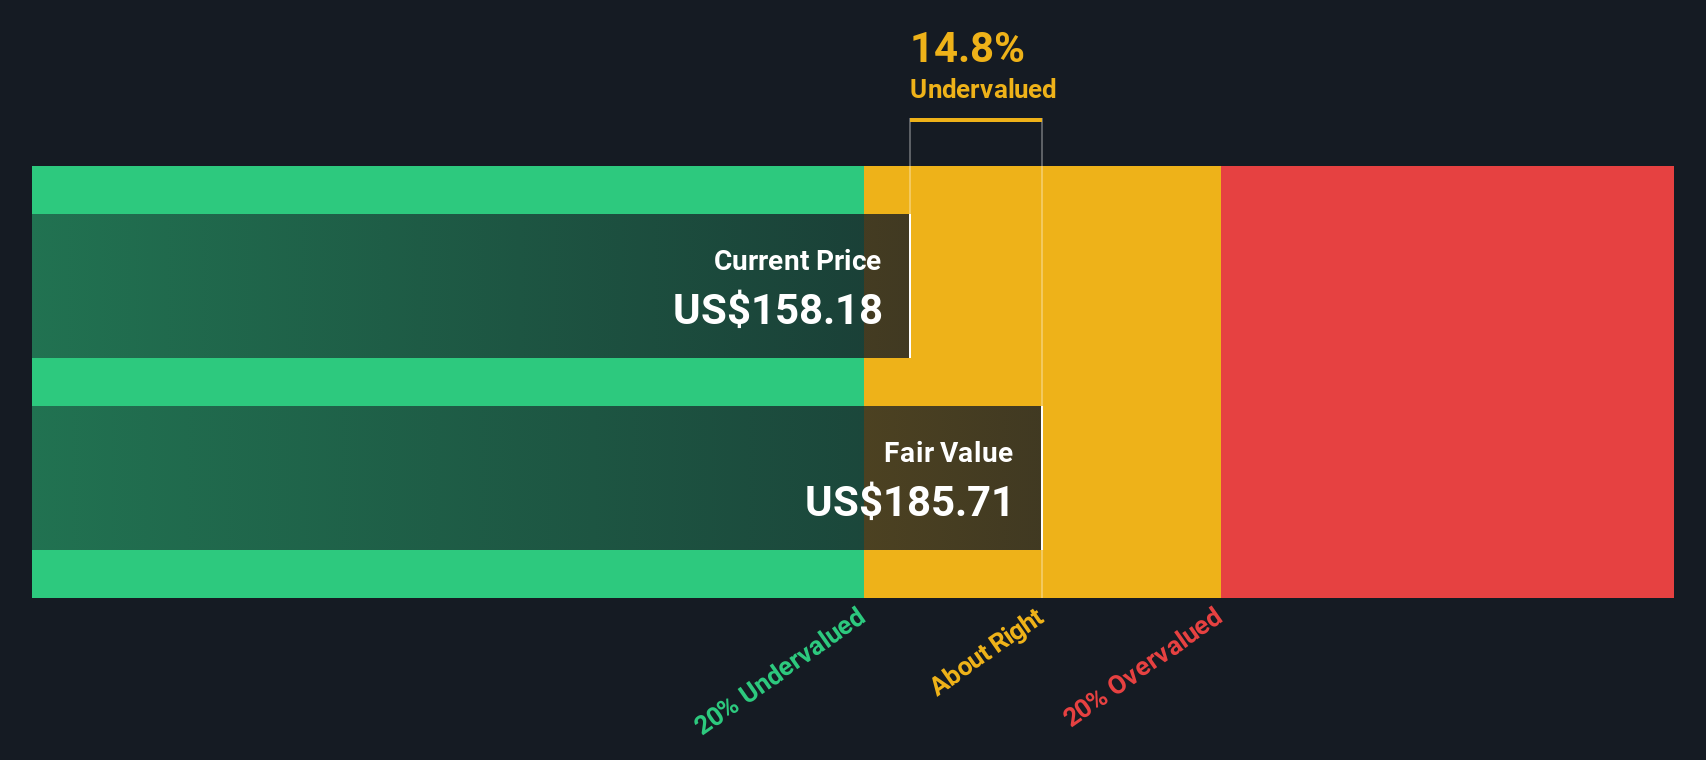
Our Discounted Cash Flow (DCF) analysis suggests Dorman Products is undervalued by 20.3%. Track this in your watchlist or portfolio, or discover more undervalued stocks.
Approach 2: Dorman Products Price vs Earnings
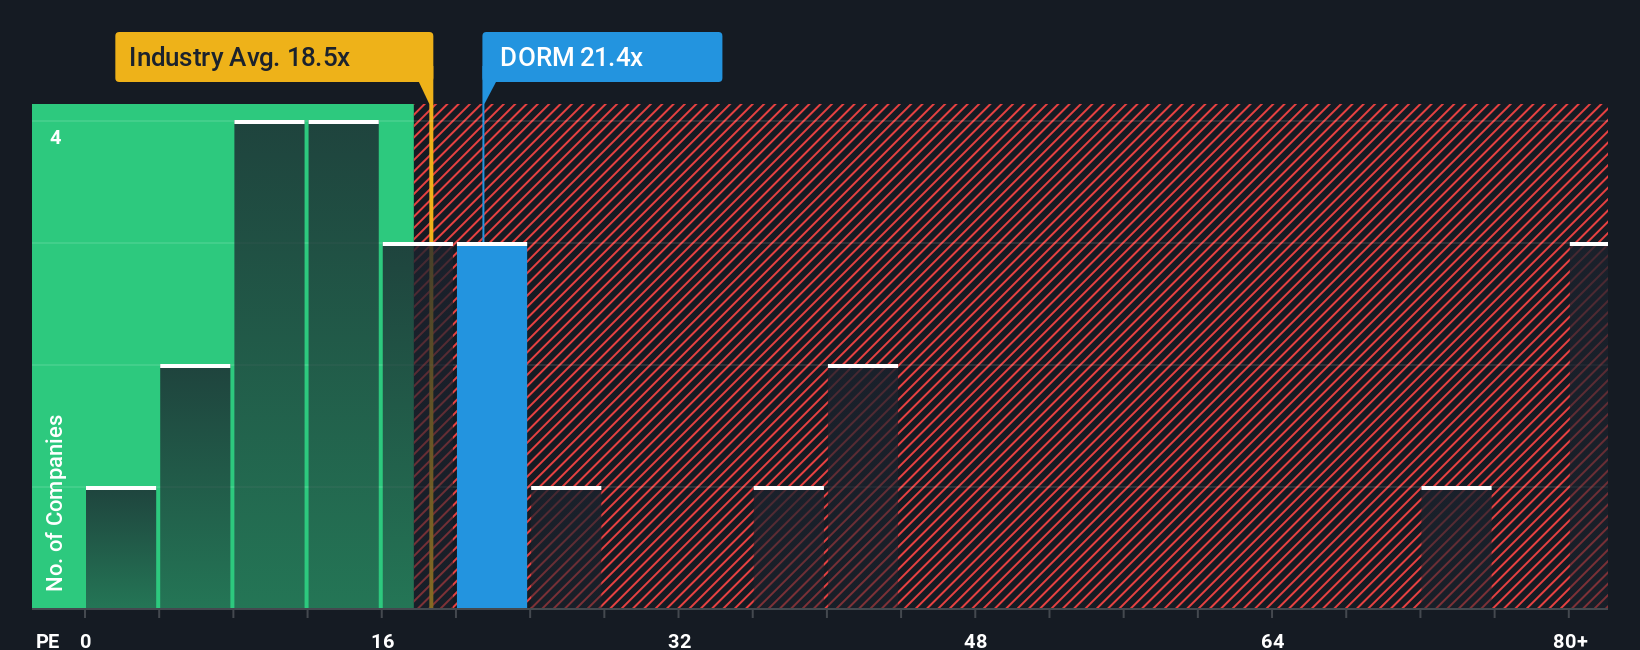
The price-to-earnings (PE) ratio is often the go-to metric for valuing profitable companies like Dorman Products. This is because it directly relates the market price of a stock to how much the company actually earns per share, giving investors a simple way to think about what they are paying for each dollar of profit. Generally, companies with higher growth prospects and lower risk will command a higher “normal” or “fair” PE ratio, since investors expect better returns and more dependable earnings streams.
Right now, Dorman Products trades at a PE ratio of 19.94x. For context, this is slightly above the Auto Components industry average of 18.83x, and just below the average of its direct peers at 20.31x. These numbers suggest that the market views Dorman in line with, or a touch more positively than, the broader sector. This likely reflects its earnings quality and track record.
However, to get a more tailored view, Simply Wall St’s proprietary “Fair Ratio” stands out. Unlike basic comparisons, the Fair Ratio is not just about what other companies trade at. Instead, it weighs vital factors like Dorman’s earnings growth outlook, profit margins, market size, and unique risks. In Dorman’s case, the Fair PE Ratio is calculated at 10.82x, based on its fundamental profile and growth forecasts. Since the current PE ratio of 19.94x is noticeably higher than its Fair Ratio, this suggests the shares are trading at a premium to what their fundamentals would typically justify.
Result: OVERVALUED
PE ratios tell one story, but what if the real opportunity lies elsewhere? Discover companies where insiders are betting big on explosive growth.
Upgrade Your Decision Making: Choose your Dorman Products Narrative
Earlier, we mentioned that there is an even better way to understand valuation, so let us introduce you to Narratives. Narratives are simple, user-driven stories that connect your view of Dorman Products' future, such as their projected revenue, profit margins, and unique risks, directly to a financial forecast and, ultimately, a fair value for the stock. Instead of just crunching numbers, Narratives allow you to state your perspective on the company, tie it to how you see the business evolving, and instantly visualize how those assumptions impact Dorman’s estimated worth.
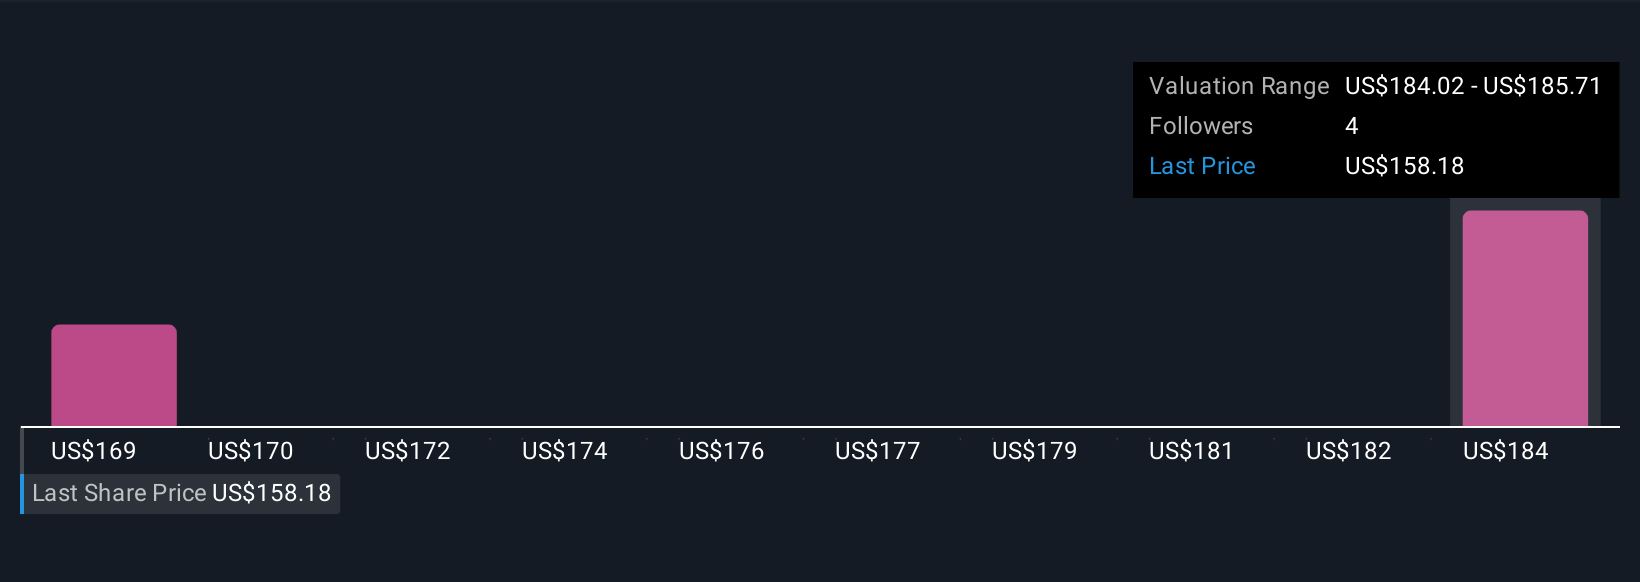
With millions of investors using the Narratives tool on Simply Wall St’s Community page, it is easy to see how others frame the company’s outlook and how the “story behind the numbers” can guide better decisions. As new events such as earnings releases or breaking news come in, Narratives update automatically, ensuring your analysis always stays current. For example, some investors view Dorman as a long-term outperformer with a fair value as high as $182.0, while others see more headwinds and set their fair value at just $135.0. Comparing your Narrative and fair value to the current share price helps clarify if now is the right time to buy, hold, or sell Dorman Products, making investing more personal, dynamic, and effective.
Do you think there's more to the story for Dorman Products? Create your own Narrative to let the Community know!
This article by Simply Wall St is general in nature. We provide commentary based on historical data and analyst forecasts only using an unbiased methodology and our articles are not intended to be financial advice. It does not constitute a recommendation to buy or sell any stock, and does not take account of your objectives, or your financial situation. We aim to bring you long-term focused analysis driven by fundamental data. Note that our analysis may not factor in the latest price-sensitive company announcements or qualitative material. Simply Wall St has no position in any stocks mentioned.
New: Manage All Your Stock Portfolios in One Place
We've created the ultimate portfolio companion for stock investors, and it's free.
• Connect an unlimited number of Portfolios and see your total in one currency
• Be alerted to new Warning Signs or Risks via email or mobile
• Track the Fair Value of your stocks
Have feedback on this article? Concerned about the content? Get in touch with us directly. Alternatively, email editorial-team@simplywallst.com
About NasdaqGS:DORM
Dorman Products
Supplies replacement and upgrade parts for the motor vehicle aftermarket industry in the United States and internationally.
Solid track record with excellent balance sheet.
Similar Companies
Market Insights

Advertisement
Community Narratives
The Next Phase of Energy Storage: How NeoVolta Is Tackling America’s Power Crunch
Fair Value US$7.50|30.4% undervalued
MA
Community Contributor
A formidable player in AI and enterprise computing.
Fair Value US$210.00|3.0% undervalued
CO
Community Contributor
IREN's Bold Moves in Sustainable Bitcoin Mining & AI Data Centers
Fair Value US$72.52|20.4% undervalued
BL
Community Contributor
Cooling the Champions: The Aussie Tech Behind F1's Victories
Fair Value AU$12.40|38.1% undervalued
TR
Community Contributor