- Taiwan
- /
- Electronic Equipment and Components
- /
- TWSE:3167
Taliang Technology (TPE:3167) Has Gifted Shareholders With A Fantastic 131% Total Return On Their Investment

If you buy and hold a stock for many years, you'd hope to be making a profit. Better yet, you'd like to see the share price move up more than the market average. But Taliang Technology Co., Ltd. (TPE:3167) has fallen short of that second goal, with a share price rise of 75% over five years, which is below the market return. But if you include dividends then the return is market-beating. Some buyers are laughing, though, with an increase of 27% in the last year.
See our latest analysis for Taliang Technology
There is no denying that markets are sometimes efficient, but prices do not always reflect underlying business performance. One way to examine how market sentiment has changed over time is to look at the interaction between a company's share price and its earnings per share (EPS).
During five years of share price growth, Taliang Technology achieved compound earnings per share (EPS) growth of 16% per year. The EPS growth is more impressive than the yearly share price gain of 12% over the same period. So one could conclude that the broader market has become more cautious towards the stock. This cautious sentiment is reflected in its (fairly low) P/E ratio of 9.83.
The company's earnings per share (over time) is depicted in the image below (click to see the exact numbers).
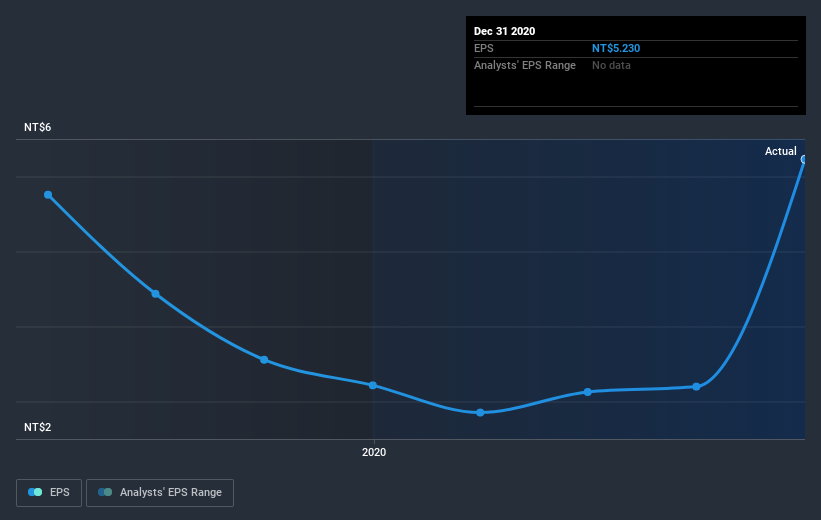
It might be well worthwhile taking a look at our free report on Taliang Technology's earnings, revenue and cash flow.
What About Dividends?
When looking at investment returns, it is important to consider the difference between total shareholder return (TSR) and share price return. Whereas the share price return only reflects the change in the share price, the TSR includes the value of dividends (assuming they were reinvested) and the benefit of any discounted capital raising or spin-off. Arguably, the TSR gives a more comprehensive picture of the return generated by a stock. We note that for Taliang Technology the TSR over the last 5 years was 131%, which is better than the share price return mentioned above. This is largely a result of its dividend payments!
A Different Perspective
Taliang Technology shareholders gained a total return of 34% during the year. But that return falls short of the market. The silver lining is that the gain was actually better than the average annual return of 18% per year over five year. This suggests the company might be improving over time. I find it very interesting to look at share price over the long term as a proxy for business performance. But to truly gain insight, we need to consider other information, too. Consider risks, for instance. Every company has them, and we've spotted 2 warning signs for Taliang Technology you should know about.
For those who like to find winning investments this free list of growing companies with recent insider purchasing, could be just the ticket.
Please note, the market returns quoted in this article reflect the market weighted average returns of stocks that currently trade on TW exchanges.
If you’re looking to trade Taliang Technology, open an account with the lowest-cost* platform trusted by professionals, Interactive Brokers. Their clients from over 200 countries and territories trade stocks, options, futures, forex, bonds and funds worldwide from a single integrated account. Promoted
Mobile Infrastructure for Defense and Disaster
The next wave in robotics isn't humanoid. Its fully autonomous towers delivering 5G, ISR, and radar in under 30 minutes, anywhere.
Get the investor briefing before the next round of contracts
Sponsored On Behalf of CiTechValuation is complex, but we're here to simplify it.
Discover if Ta Liang Technology might be undervalued or overvalued with our detailed analysis, featuring fair value estimates, potential risks, dividends, insider trades, and its financial condition.
Access Free AnalysisThis article by Simply Wall St is general in nature. It does not constitute a recommendation to buy or sell any stock, and does not take account of your objectives, or your financial situation. We aim to bring you long-term focused analysis driven by fundamental data. Note that our analysis may not factor in the latest price-sensitive company announcements or qualitative material. Simply Wall St has no position in any stocks mentioned.
*Interactive Brokers Rated Lowest Cost Broker by StockBrokers.com Annual Online Review 2020
Have feedback on this article? Concerned about the content? Get in touch with us directly. Alternatively, email editorial-team (at) simplywallst.com.
About TWSE:3167
Ta Liang Technology
Engages in the manufacturing of semiconductor inspection, PCB routing and drilling machines, resin panel cutters, CNC engraving and milling machines, and glass panel processing machines in Taiwan.
Excellent balance sheet with acceptable track record.
Similar Companies
Market Insights

Weekly Picks

Early mover in a fast growing industry. Likely to experience share price volatility as they scale


A case for CA$31.80 (undiluted), aka 8,616% upside from CA$0.37 (an 86 bagger!).


Moderation and Stabilisation: HOLD: Fair Price based on a 4-year Cycle is $12.08
Recently Updated Narratives


An amazing opportunity to potentially get a 100 bagger

Amazon: Why the World’s Biggest Platform Still Runs on Invisible Economics

Sunrun Stock: When the Energy Transition Collides With the Cost of Capital
Popular Narratives


MicroVision will explode future revenue by 380.37% with a vision towards success


Crazy Undervalued 42 Baggers Silver Play (Active & Running Mine)

