There's no doubt that money can be made by owning shares of unprofitable businesses. For example, biotech and mining exploration companies often lose money for years before finding success with a new treatment or mineral discovery. Nonetheless, only a fool would ignore the risk that a loss making company burns through its cash too quickly.
Given this risk, we thought we'd take a look at whether HTC (TPE:2498) shareholders should be worried about its cash burn. In this report, we will consider the company's annual negative free cash flow, henceforth referring to it as the 'cash burn'. We'll start by comparing its cash burn with its cash reserves in order to calculate its cash runway.
See our latest analysis for HTC
Does HTC Have A Long Cash Runway?
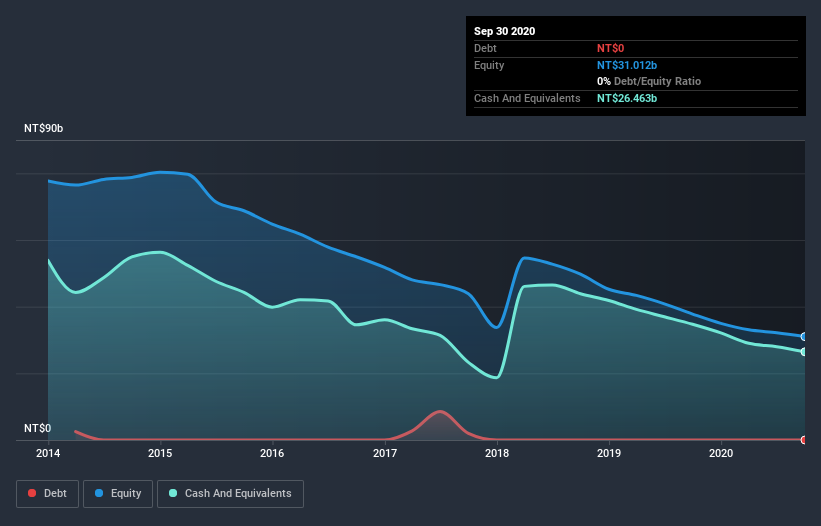
A company's cash runway is the amount of time it would take to burn through its cash reserves at its current cash burn rate. As at September 2020, HTC had cash of NT$26b and no debt. Looking at the last year, the company burnt through NT$9.0b. Therefore, from September 2020 it had 3.0 years of cash runway. That's decent, giving the company a couple years to develop its business. The image below shows how its cash balance has been changing over the last few years.

How Well Is HTC Growing?
On balance, we think it's mildly positive that HTC trimmed its cash burn by 3.9% over the last twelve months. In contrast, however, operating revenue tanked 51% during the period. Considering both these metrics, we're a little concerned about how the company is developing. Of course, we've only taken a quick look at the stock's growth metrics, here. You can take a look at how HTC has developed its business over time by checking this visualization of its revenue and earnings history.
Can HTC Raise More Cash Easily?
While HTC seems to be in a fairly good position, it's still worth considering how easily it could raise more cash, even just to fuel faster growth. Issuing new shares, or taking on debt, are the most common ways for a listed company to raise more money for its business. One of the main advantages held by publicly listed companies is that they can sell shares to investors to raise cash and fund growth. By looking at a company's cash burn relative to its market capitalisation, we gain insight on how much shareholders would be diluted if the company needed to raise enough cash to cover another year's cash burn.
HTC's cash burn of NT$9.0b is about 35% of its NT$25b market capitalisation. That's not insignificant, and if the company had to sell enough shares to fund another year's growth at the current share price, you'd likely witness fairly costly dilution.
Is HTC's Cash Burn A Worry?
On this analysis of HTC's cash burn, we think its cash runway was reassuring, while its falling revenue has us a bit worried. Even though we don't think it has a problem with its cash burn, the analysis we've done in this article does suggest that shareholders should give some careful thought to the potential cost of raising more money in the future. For us, it's always important to consider risks around cash burn rates. But investors should look at a whole range of factors when researching a new stock. For example, it could be interesting to see how much the HTC CEO receives in total remuneration.
Of course, you might find a fantastic investment by looking elsewhere. So take a peek at this free list of interesting companies, and this list of stocks growth stocks (according to analyst forecasts)
When trading HTC or any other investment, use the platform considered by many to be the Professional's Gateway to the Worlds Market, Interactive Brokers. You get the lowest-cost* trading on stocks, options, futures, forex, bonds and funds worldwide from a single integrated account. Promoted
Valuation is complex, but we're here to simplify it.
Discover if HTC might be undervalued or overvalued with our detailed analysis, featuring fair value estimates, potential risks, dividends, insider trades, and its financial condition.
Access Free AnalysisThis article by Simply Wall St is general in nature. It does not constitute a recommendation to buy or sell any stock, and does not take account of your objectives, or your financial situation. We aim to bring you long-term focused analysis driven by fundamental data. Note that our analysis may not factor in the latest price-sensitive company announcements or qualitative material. Simply Wall St has no position in any stocks mentioned.
*Interactive Brokers Rated Lowest Cost Broker by StockBrokers.com Annual Online Review 2020
Have feedback on this article? Concerned about the content? Get in touch with us directly. Alternatively, email editorial-team@simplywallst.com.
About TWSE:2498
HTC
Designs, manufactures, assembles, processes, and sells smart mobile and virtual reality devices in Taiwan and internationally.
Acceptable track record with mediocre balance sheet.
Similar Companies
Market Insights
Weekly Picks


Crazy Undervalued 42 Baggers Silver Play (Active & Running Mine)


Fiducian: Compliance Clouds or Value Opportunity?

Willamette Valley Vineyards (WVVI): Not-So-Great Value
Recently Updated Narratives

Silver's Breakout to over $50US will make Magma’s future shine with drill sampling returning 115g/t Silver and 2.3 g/t Gold at its Peru Mine

SEGRO's Revenue to Rise 14.7% Amidst Optimistic Growth Plans

After the AI Party: A Sobering Look at Microsoft's Future
Popular Narratives


MicroVision will explode future revenue by 380.37% with a vision towards success


NVDA: Expanding AI Demand Will Drive Major Data Center Investments Through 2026


