
Does the April share price for Innodisk Corporation (GTSM:5289) reflect what it's really worth? Today, we will estimate the stock's intrinsic value by taking the forecast future cash flows of the company and discounting them back to today's value. The Discounted Cash Flow (DCF) model is the tool we will apply to do this. There's really not all that much to it, even though it might appear quite complex.
Remember though, that there are many ways to estimate a company's value, and a DCF is just one method. For those who are keen learners of equity analysis, the Simply Wall St analysis model here may be something of interest to you.
See our latest analysis for Innodisk
The method
We use what is known as a 2-stage model, which simply means we have two different periods of growth rates for the company's cash flows. Generally the first stage is higher growth, and the second stage is a lower growth phase. To start off with, we need to estimate the next ten years of cash flows. Where possible we use analyst estimates, but when these aren't available we extrapolate the previous free cash flow (FCF) from the last estimate or reported value. We assume companies with shrinking free cash flow will slow their rate of shrinkage, and that companies with growing free cash flow will see their growth rate slow, over this period. We do this to reflect that growth tends to slow more in the early years than it does in later years.
Generally we assume that a dollar today is more valuable than a dollar in the future, and so the sum of these future cash flows is then discounted to today's value:
10-year free cash flow (FCF) forecast
| 2021 | 2022 | 2023 | 2024 | 2025 | 2026 | 2027 | 2028 | 2029 | 2030 | |
| Levered FCF (NT$, Millions) | NT$931.0m | NT$997.0m | NT$986.8m | NT$982.2m | NT$981.4m | NT$983.3m | NT$987.1m | NT$992.2m | NT$998.3m | NT$1.01b |
| Growth Rate Estimate Source | Analyst x1 | Analyst x1 | Est @ -1.02% | Est @ -0.47% | Est @ -0.08% | Est @ 0.19% | Est @ 0.38% | Est @ 0.52% | Est @ 0.61% | Est @ 0.68% |
| Present Value (NT$, Millions) Discounted @ 7.7% | NT$864 | NT$859 | NT$789 | NT$729 | NT$676 | NT$629 | NT$586 | NT$546 | NT$510 | NT$477 |
("Est" = FCF growth rate estimated by Simply Wall St)
Present Value of 10-year Cash Flow (PVCF) = NT$6.7b
After calculating the present value of future cash flows in the initial 10-year period, we need to calculate the Terminal Value, which accounts for all future cash flows beyond the first stage. The Gordon Growth formula is used to calculate Terminal Value at a future annual growth rate equal to the 5-year average of the 10-year government bond yield of 0.8%. We discount the terminal cash flows to today's value at a cost of equity of 7.7%.
Terminal Value (TV)= FCF2030 × (1 + g) ÷ (r – g) = NT$1.0b× (1 + 0.8%) ÷ (7.7%– 0.8%) = NT$15b
Present Value of Terminal Value (PVTV)= TV / (1 + r)10= NT$15b÷ ( 1 + 7.7%)10= NT$7.0b
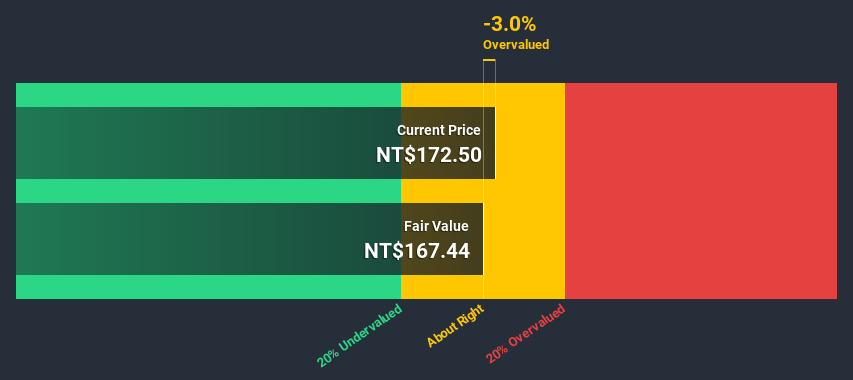
The total value, or equity value, is then the sum of the present value of the future cash flows, which in this case is NT$14b. In the final step we divide the equity value by the number of shares outstanding. Compared to the current share price of NT$173, the company appears around fair value at the time of writing. Remember though, that this is just an approximate valuation, and like any complex formula - garbage in, garbage out.
Important assumptions
We would point out that the most important inputs to a discounted cash flow are the discount rate and of course the actual cash flows. If you don't agree with these result, have a go at the calculation yourself and play with the assumptions. The DCF also does not consider the possible cyclicality of an industry, or a company's future capital requirements, so it does not give a full picture of a company's potential performance. Given that we are looking at Innodisk as potential shareholders, the cost of equity is used as the discount rate, rather than the cost of capital (or weighted average cost of capital, WACC) which accounts for debt. In this calculation we've used 7.7%, which is based on a levered beta of 1.130. Beta is a measure of a stock's volatility, compared to the market as a whole. We get our beta from the industry average beta of globally comparable companies, with an imposed limit between 0.8 and 2.0, which is a reasonable range for a stable business.
Looking Ahead:
Valuation is only one side of the coin in terms of building your investment thesis, and it is only one of many factors that you need to assess for a company. It's not possible to obtain a foolproof valuation with a DCF model. Rather it should be seen as a guide to "what assumptions need to be true for this stock to be under/overvalued?" If a company grows at a different rate, or if its cost of equity or risk free rate changes sharply, the output can look very different. For Innodisk, we've put together three important items you should explore:
- Risks: Be aware that Innodisk is showing 1 warning sign in our investment analysis , you should know about...
- Future Earnings: How does 5289's growth rate compare to its peers and the wider market? Dig deeper into the analyst consensus number for the upcoming years by interacting with our free analyst growth expectation chart.
- Other High Quality Alternatives: Do you like a good all-rounder? Explore our interactive list of high quality stocks to get an idea of what else is out there you may be missing!
PS. Simply Wall St updates its DCF calculation for every Taiwanese stock every day, so if you want to find the intrinsic value of any other stock just search here.
When trading Innodisk or any other investment, use the platform considered by many to be the Professional's Gateway to the Worlds Market, Interactive Brokers. You get the lowest-cost* trading on stocks, options, futures, forex, bonds and funds worldwide from a single integrated account. Promoted
The New Payments ETF Is Live on NASDAQ:
Money is moving to real-time rails, and a newly listed ETF now gives investors direct exposure. Fast settlement. Institutional custody. Simple access.
Explore how this launch could reshape portfolios
Sponsored ContentNew: AI Stock Screener & Alerts
Our new AI Stock Screener scans the market every day to uncover opportunities.
• Dividend Powerhouses (3%+ Yield)
• Undervalued Small Caps with Insider Buying
• High growth Tech and AI Companies
Or build your own from over 50 metrics.
This article by Simply Wall St is general in nature. It does not constitute a recommendation to buy or sell any stock, and does not take account of your objectives, or your financial situation. We aim to bring you long-term focused analysis driven by fundamental data. Note that our analysis may not factor in the latest price-sensitive company announcements or qualitative material. Simply Wall St has no position in any stocks mentioned.
*Interactive Brokers Rated Lowest Cost Broker by StockBrokers.com Annual Online Review 2020
Have feedback on this article? Concerned about the content? Get in touch with us directly. Alternatively, email editorial-team (at) simplywallst.com.
About TPEX:5289
Innodisk
Researches, develops, manufactures, and sales industrial embedded storage devices in Taiwan, Asia, Japan, Germany, China, Europe, the United States, and internationally.
Exceptional growth potential with adequate balance sheet.
Similar Companies
Market Insights

Weekly Picks

Early mover in a fast growing industry. Likely to experience share price volatility as they scale


A case for CA$31.80 (undiluted), aka 8,616% upside from CA$0.37 (an 86 bagger!).


Moderation and Stabilisation: HOLD: Fair Price based on a 4-year Cycle is $12.08
Recently Updated Narratives


Title: Market Sentiment Is Dead Wrong — Here's Why PSEC Deserves a Second Look


An amazing opportunity to potentially get a 100 bagger

Amazon: Why the World’s Biggest Platform Still Runs on Invisible Economics
Popular Narratives


MicroVision will explode future revenue by 380.37% with a vision towards success


Crazy Undervalued 42 Baggers Silver Play (Active & Running Mine)


NVDA: Expanding AI Demand Will Drive Major Data Center Investments Through 2026
Trending Discussion
