
Advertisement
- Taiwan
- /
- Semiconductors
- /
- TWSE:8104
Improved Revenues Required Before RiTdisplay Corporation (TWSE:8104) Stock's 28% Jump Looks Justified
Despite an already strong run, RiTdisplay Corporation (TWSE:8104) shares have been powering on, with a gain of 28% in the last thirty days. Looking further back, the 10% rise over the last twelve months isn't too bad notwithstanding the strength over the last 30 days.
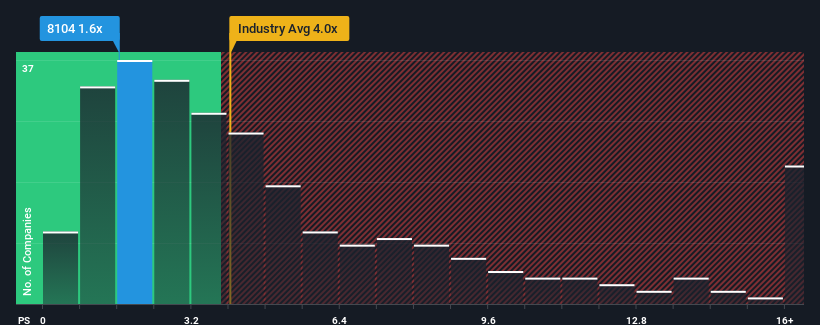
Although its price has surged higher, RiTdisplay may still be sending very bullish signals at the moment with its price-to-sales (or "P/S") ratio of 1.6x, since almost half of all companies in the Semiconductor industry in Taiwan have P/S ratios greater than 4x and even P/S higher than 8x are not unusual. Nonetheless, we'd need to dig a little deeper to determine if there is a rational basis for the highly reduced P/S.
See our latest analysis for RiTdisplay
How RiTdisplay Has Been Performing
As an illustration, revenue has deteriorated at RiTdisplay over the last year, which is not ideal at all. Perhaps the market believes the recent revenue performance isn't good enough to keep up the industry, causing the P/S ratio to suffer. Those who are bullish on RiTdisplay will be hoping that this isn't the case so that they can pick up the stock at a lower valuation.
We don't have analyst forecasts, but you can see how recent trends are setting up the company for the future by checking out our free report on RiTdisplay's earnings, revenue and cash flow.Is There Any Revenue Growth Forecasted For RiTdisplay?
There's an inherent assumption that a company should far underperform the industry for P/S ratios like RiTdisplay's to be considered reasonable.
Taking a look back first, the company's revenue growth last year wasn't something to get excited about as it posted a disappointing decline of 14%. Still, the latest three year period has seen an excellent 38% overall rise in revenue, in spite of its unsatisfying short-term performance. Although it's been a bumpy ride, it's still fair to say the revenue growth recently has been more than adequate for the company.
This is in contrast to the rest of the industry, which is expected to grow by 26% over the next year, materially higher than the company's recent medium-term annualised growth rates.
With this in consideration, it's easy to understand why RiTdisplay's P/S falls short of the mark set by its industry peers. Apparently many shareholders weren't comfortable holding on to something they believe will continue to trail the wider industry.
The Final Word
Even after such a strong price move, RiTdisplay's P/S still trails the rest of the industry. While the price-to-sales ratio shouldn't be the defining factor in whether you buy a stock or not, it's quite a capable barometer of revenue expectations.
Our examination of RiTdisplay confirms that the company's revenue trends over the past three-year years are a key factor in its low price-to-sales ratio, as we suspected, given they fall short of current industry expectations. Right now shareholders are accepting the low P/S as they concede future revenue probably won't provide any pleasant surprises. Unless the recent medium-term conditions improve, they will continue to form a barrier for the share price around these levels.
It's always necessary to consider the ever-present spectre of investment risk. We've identified 3 warning signs with RiTdisplay (at least 1 which doesn't sit too well with us), and understanding them should be part of your investment process.
It's important to make sure you look for a great company, not just the first idea you come across. So if growing profitability aligns with your idea of a great company, take a peek at this free list of interesting companies with strong recent earnings growth (and a low P/E).
New: AI Stock Screener & Alerts
Our new AI Stock Screener scans the market every day to uncover opportunities.
• Dividend Powerhouses (3%+ Yield)
• Undervalued Small Caps with Insider Buying
• High growth Tech and AI Companies
Or build your own from over 50 metrics.
Have feedback on this article? Concerned about the content? Get in touch with us directly. Alternatively, email editorial-team (at) simplywallst.com.
This article by Simply Wall St is general in nature. We provide commentary based on historical data and analyst forecasts only using an unbiased methodology and our articles are not intended to be financial advice. It does not constitute a recommendation to buy or sell any stock, and does not take account of your objectives, or your financial situation. We aim to bring you long-term focused analysis driven by fundamental data. Note that our analysis may not factor in the latest price-sensitive company announcements or qualitative material. Simply Wall St has no position in any stocks mentioned.
Have feedback on this article? Concerned about the content? Get in touch with us directly. Alternatively, email editorial-team@simplywallst.com
About TWSE:8104
RiTdisplay
Engages in the research, development, and manufacturing of PMOLED products in Taiwan and internationally.
Fair value with low risk.
Similar Companies
Market Insights

Advertisement
Community Narratives
MINISO's fair value is projected at 26.69 with an anticipated PE ratio shift of 20x
Fair Value US$24.03|11.0% undervalued
BE
Community Contributor
Procter & Gamble: A Dividend Giant Facing Slowing Growth
Fair Value US$119.81|23.3% overvalued
AN
Community Contributor
Eli Lilly's Future Growth Driven by Tirzepatide and Favorable Market Conditions
Fair Value US$1.19k|13.8% undervalued
EA
Community Contributor