- Taiwan
- /
- Semiconductors
- /
- TWSE:8081
Global Mixed-Mode Technology's (TWSE:8081) 38% CAGR outpaced the company's earnings growth over the same five-year period


The most you can lose on any stock (assuming you don't use leverage) is 100% of your money. But on the bright side, you can make far more than 100% on a really good stock. One great example is Global Mixed-Mode Technology Inc. (TWSE:8081) which saw its share price drive 265% higher over five years. It's also good to see the share price up 23% over the last quarter. But this could be related to the strong market, which is up 14% in the last three months.
After a strong gain in the past week, it's worth seeing if longer term returns have been driven by improving fundamentals.
Check out our latest analysis for Global Mixed-Mode Technology
There is no denying that markets are sometimes efficient, but prices do not always reflect underlying business performance. One way to examine how market sentiment has changed over time is to look at the interaction between a company's share price and its earnings per share (EPS).
During five years of share price growth, Global Mixed-Mode Technology achieved compound earnings per share (EPS) growth of 23% per year. This EPS growth is lower than the 30% average annual increase in the share price. So it's fair to assume the market has a higher opinion of the business than it did five years ago. That's not necessarily surprising considering the five-year track record of earnings growth.
You can see how EPS has changed over time in the image below (click on the chart to see the exact values).
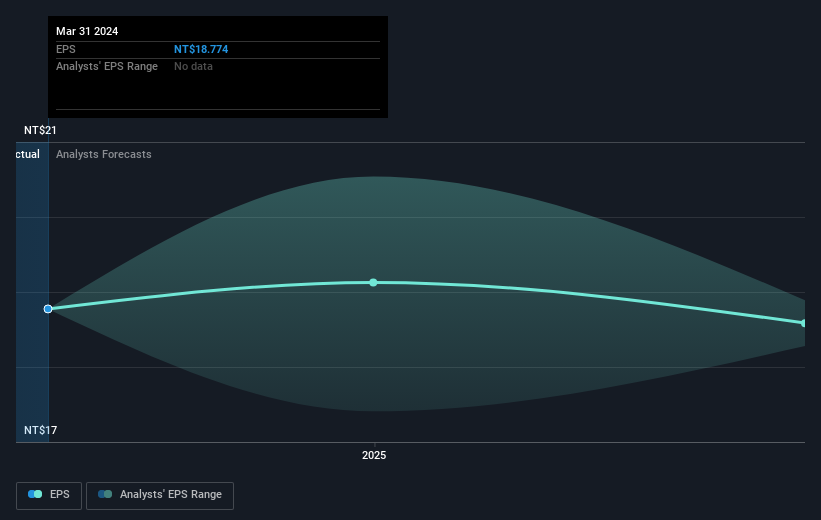
This free interactive report on Global Mixed-Mode Technology's earnings, revenue and cash flow is a great place to start, if you want to investigate the stock further.
What About Dividends?
It is important to consider the total shareholder return, as well as the share price return, for any given stock. The TSR incorporates the value of any spin-offs or discounted capital raisings, along with any dividends, based on the assumption that the dividends are reinvested. Arguably, the TSR gives a more comprehensive picture of the return generated by a stock. As it happens, Global Mixed-Mode Technology's TSR for the last 5 years was 393%, which exceeds the share price return mentioned earlier. The dividends paid by the company have thusly boosted the total shareholder return.
A Different Perspective
It's nice to see that Global Mixed-Mode Technology shareholders have received a total shareholder return of 81% over the last year. And that does include the dividend. That gain is better than the annual TSR over five years, which is 38%. Therefore it seems like sentiment around the company has been positive lately. In the best case scenario, this may hint at some real business momentum, implying that now could be a great time to delve deeper. I find it very interesting to look at share price over the long term as a proxy for business performance. But to truly gain insight, we need to consider other information, too. For instance, we've identified 2 warning signs for Global Mixed-Mode Technology (1 makes us a bit uncomfortable) that you should be aware of.
But note: Global Mixed-Mode Technology may not be the best stock to buy. So take a peek at this free list of interesting companies with past earnings growth (and further growth forecast).
Please note, the market returns quoted in this article reflect the market weighted average returns of stocks that currently trade on Taiwanese exchanges.
New: Manage All Your Stock Portfolios in One Place
We've created the ultimate portfolio companion for stock investors, and it's free.
• Connect an unlimited number of Portfolios and see your total in one currency
• Be alerted to new Warning Signs or Risks via email or mobile
• Track the Fair Value of your stocks
Have feedback on this article? Concerned about the content? Get in touch with us directly. Alternatively, email editorial-team (at) simplywallst.com.
This article by Simply Wall St is general in nature. We provide commentary based on historical data and analyst forecasts only using an unbiased methodology and our articles are not intended to be financial advice. It does not constitute a recommendation to buy or sell any stock, and does not take account of your objectives, or your financial situation. We aim to bring you long-term focused analysis driven by fundamental data. Note that our analysis may not factor in the latest price-sensitive company announcements or qualitative material. Simply Wall St has no position in any stocks mentioned.
About TWSE:8081
Global Mixed-Mode Technology
Engages in the production, manufacturing, and sales of digital and analog mixed integrated circuits in Taiwan and internationally.
Flawless balance sheet 6 star dividend payer.
