
Advertisement
- Taiwan
- /
- Semiconductors
- /
- TWSE:3653
What Can The Trends At Jentech Precision Industrial (TPE:3653) Tell Us About Their Returns?

What trends should we look for it we want to identify stocks that can multiply in value over the long term? Firstly, we'd want to identify a growing return on capital employed (ROCE) and then alongside that, an ever-increasing base of capital employed. If you see this, it typically means it's a company with a great business model and plenty of profitable reinvestment opportunities. So on that note, Jentech Precision Industrial (TPE:3653) looks quite promising in regards to its trends of return on capital.
What is Return On Capital Employed (ROCE)?
For those that aren't sure what ROCE is, it measures the amount of pre-tax profits a company can generate from the capital employed in its business. The formula for this calculation on Jentech Precision Industrial is:
Return on Capital Employed = Earnings Before Interest and Tax (EBIT) ÷ (Total Assets - Current Liabilities)
0.17 = NT$1.2b ÷ (NT$9.6b - NT$2.4b) (Based on the trailing twelve months to September 2020).
Thus, Jentech Precision Industrial has an ROCE of 17%. In absolute terms, that's a satisfactory return, but compared to the Semiconductor industry average of 11% it's much better.
See our latest analysis for Jentech Precision Industrial
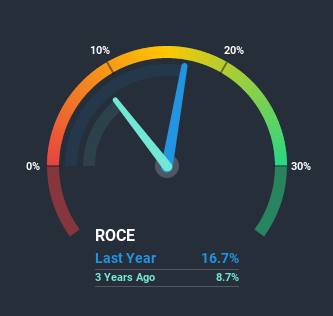
While the past is not representative of the future, it can be helpful to know how a company has performed historically, which is why we have this chart above. If you're interested in investigating Jentech Precision Industrial's past further, check out this free graph of past earnings, revenue and cash flow.
What Can We Tell From Jentech Precision Industrial's ROCE Trend?
Jentech Precision Industrial is displaying some positive trends. Over the last five years, returns on capital employed have risen substantially to 17%. The amount of capital employed has increased too, by 61%. So we're very much inspired by what we're seeing at Jentech Precision Industrial thanks to its ability to profitably reinvest capital.
For the record though, there was a noticeable increase in the company's current liabilities over the period, so we would attribute some of the ROCE growth to that. The current liabilities has increased to 25% of total assets, so the business is now more funded by the likes of its suppliers or short-term creditors. Keep an eye out for future increases because when the ratio of current liabilities to total assets gets particularly high, this can introduce some new risks for the business.
In Conclusion...
In summary, it's great to see that Jentech Precision Industrial can compound returns by consistently reinvesting capital at increasing rates of return, because these are some of the key ingredients of those highly sought after multi-baggers. Since the stock has returned a staggering 782% to shareholders over the last five years, it looks like investors are recognizing these changes. So given the stock has proven it has promising trends, it's worth researching the company further to see if these trends are likely to persist.
While Jentech Precision Industrial looks impressive, no company is worth an infinite price. The intrinsic value infographic in our free research report helps visualize whether 3653 is currently trading for a fair price.
While Jentech Precision Industrial may not currently earn the highest returns, we've compiled a list of companies that currently earn more than 25% return on equity. Check out this free list here.
When trading Jentech Precision Industrial or any other investment, use the platform considered by many to be the Professional's Gateway to the Worlds Market, Interactive Brokers. You get the lowest-cost* trading on stocks, options, futures, forex, bonds and funds worldwide from a single integrated account. Promoted
New: Manage All Your Stock Portfolios in One Place
We've created the ultimate portfolio companion for stock investors, and it's free.
• Connect an unlimited number of Portfolios and see your total in one currency
• Be alerted to new Warning Signs or Risks via email or mobile
• Track the Fair Value of your stocks
This article by Simply Wall St is general in nature. It does not constitute a recommendation to buy or sell any stock, and does not take account of your objectives, or your financial situation. We aim to bring you long-term focused analysis driven by fundamental data. Note that our analysis may not factor in the latest price-sensitive company announcements or qualitative material. Simply Wall St has no position in any stocks mentioned.
*Interactive Brokers Rated Lowest Cost Broker by StockBrokers.com Annual Online Review 2020
Have feedback on this article? Concerned about the content? Get in touch with us directly. Alternatively, email editorial-team (at) simplywallst.com.
About TWSE:3653
Jentech Precision Industrial
Manufactures and sells precision molds worldwide.
Outstanding track record with flawless balance sheet.
Similar Companies
Market Insights

Advertisement
Community Narratives
The Most Undervalued of the Magnificent 7
Fair Value US$237.43|36.3% undervalued
IN
Community Contributor
PVA TePla's New Strategy Aims for 22% Revenue Growth in Semiconductor Recovery
Fair Value €19.19|20.8% undervalued
MI
Community Contributor