- Taiwan
- /
- Semiconductors
- /
- TPEX:8383
Chen Full International's (GTSM:8383) Stock Price Has Reduced 21% In The Past Three Years


For many investors, the main point of stock picking is to generate higher returns than the overall market. But its virtually certain that sometimes you will buy stocks that fall short of the market average returns. We regret to report that long term Chen Full International Co., Ltd. (GTSM:8383) shareholders have had that experience, with the share price dropping 21% in three years, versus a market return of about 58%. Shareholders have had an even rougher run lately, with the share price down 13% in the last 90 days.
See our latest analysis for Chen Full International
While the efficient markets hypothesis continues to be taught by some, it has been proven that markets are over-reactive dynamic systems, and investors are not always rational. One way to examine how market sentiment has changed over time is to look at the interaction between a company's share price and its earnings per share (EPS).
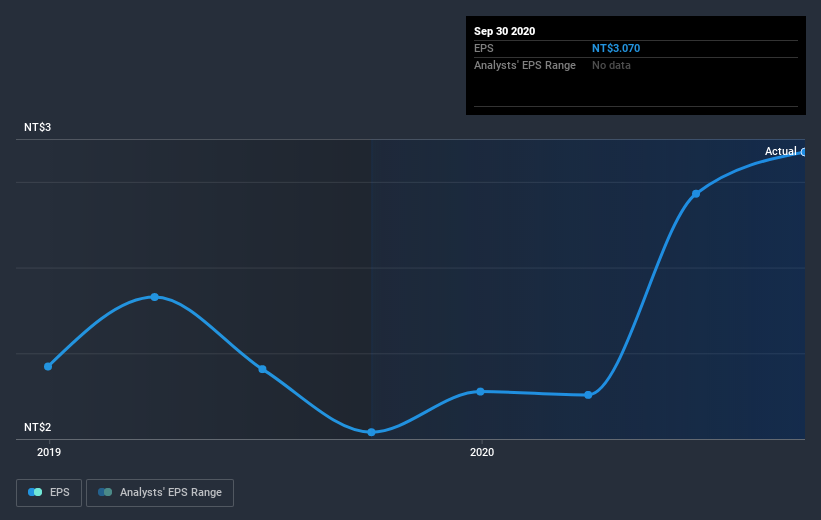
Chen Full International saw its EPS decline at a compound rate of 10% per year, over the last three years. This fall in the EPS is worse than the 7% compound annual share price fall. This suggests that the market retains some optimism around long term earnings stability, despite past EPS declines.
The image below shows how EPS has tracked over time (if you click on the image you can see greater detail).
We know that Chen Full International has improved its bottom line lately, but is it going to grow revenue? If you're interested, you could check this free report showing consensus revenue forecasts.
What About Dividends?
When looking at investment returns, it is important to consider the difference between total shareholder return (TSR) and share price return. Whereas the share price return only reflects the change in the share price, the TSR includes the value of dividends (assuming they were reinvested) and the benefit of any discounted capital raising or spin-off. It's fair to say that the TSR gives a more complete picture for stocks that pay a dividend. We note that for Chen Full International the TSR over the last 3 years was -3.8%, which is better than the share price return mentioned above. And there's no prize for guessing that the dividend payments largely explain the divergence!
A Different Perspective
Chen Full International shareholders gained a total return of 17% during the year. Unfortunately this falls short of the market return. On the bright side, that's still a gain, and it's actually better than the average return of 5% over half a decade This suggests the company might be improving over time. I find it very interesting to look at share price over the long term as a proxy for business performance. But to truly gain insight, we need to consider other information, too. Case in point: We've spotted 2 warning signs for Chen Full International you should be aware of, and 1 of them is significant.
For those who like to find winning investments this free list of growing companies with recent insider purchasing, could be just the ticket.
Please note, the market returns quoted in this article reflect the market weighted average returns of stocks that currently trade on TW exchanges.
If you’re looking to trade Chen Full International, open an account with the lowest-cost* platform trusted by professionals, Interactive Brokers. Their clients from over 200 countries and territories trade stocks, options, futures, forex, bonds and funds worldwide from a single integrated account. Promoted
New: AI Stock Screener & Alerts
Our new AI Stock Screener scans the market every day to uncover opportunities.
• Dividend Powerhouses (3%+ Yield)
• Undervalued Small Caps with Insider Buying
• High growth Tech and AI Companies
Or build your own from over 50 metrics.
This article by Simply Wall St is general in nature. It does not constitute a recommendation to buy or sell any stock, and does not take account of your objectives, or your financial situation. We aim to bring you long-term focused analysis driven by fundamental data. Note that our analysis may not factor in the latest price-sensitive company announcements or qualitative material. Simply Wall St has no position in any stocks mentioned.
*Interactive Brokers Rated Lowest Cost Broker by StockBrokers.com Annual Online Review 2020
Have feedback on this article? Concerned about the content? Get in touch with us directly. Alternatively, email editorial-team (at) simplywallst.com.
About TPEX:8383
Chen Full International
Engages in the engineering and machinery businesses in Taiwan and internationally.
Adequate balance sheet average dividend payer.
Similar Companies
Market Insights

Community Narratives

