Returns on Capital Paint A Bright Future For momo.com (TWSE:8454)


If we want to find a stock that could multiply over the long term, what are the underlying trends we should look for? Firstly, we'll want to see a proven return on capital employed (ROCE) that is increasing, and secondly, an expanding base of capital employed. Put simply, these types of businesses are compounding machines, meaning they are continually reinvesting their earnings at ever-higher rates of return. With that in mind, the ROCE of momo.com (TWSE:8454) looks great, so lets see what the trend can tell us.
Return On Capital Employed (ROCE): What Is It?
If you haven't worked with ROCE before, it measures the 'return' (pre-tax profit) a company generates from capital employed in its business. To calculate this metric for momo.com, this is the formula:
Return on Capital Employed = Earnings Before Interest and Tax (EBIT) ÷ (Total Assets - Current Liabilities)
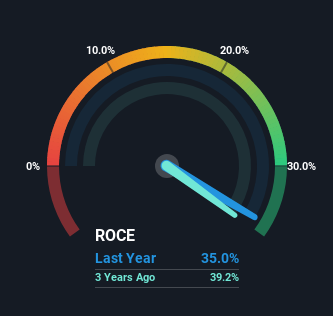
0.35 = NT$4.2b ÷ (NT$26b - NT$14b) (Based on the trailing twelve months to September 2024).
So, momo.com has an ROCE of 35%. In absolute terms that's a great return and it's even better than the Multiline Retail industry average of 4.3%.
See our latest analysis for momo.com
In the above chart we have measured momo.com's prior ROCE against its prior performance, but the future is arguably more important. If you'd like, you can check out the forecasts from the analysts covering momo.com for free.
What Can We Tell From momo.com's ROCE Trend?
The trends we've noticed at momo.com are quite reassuring. The data shows that returns on capital have increased substantially over the last five years to 35%. Basically the business is earning more per dollar of capital invested and in addition to that, 72% more capital is being employed now too. The increasing returns on a growing amount of capital is common amongst multi-baggers and that's why we're impressed.
Another thing to note, momo.com has a high ratio of current liabilities to total assets of 54%. This can bring about some risks because the company is basically operating with a rather large reliance on its suppliers or other sorts of short-term creditors. While it's not necessarily a bad thing, it can be beneficial if this ratio is lower.
In Conclusion...
All in all, it's terrific to see that momo.com is reaping the rewards from prior investments and is growing its capital base. And with the stock having performed exceptionally well over the last five years, these patterns are being accounted for by investors. With that being said, we still think the promising fundamentals mean the company deserves some further due diligence.
If you'd like to know about the risks facing momo.com, we've discovered 1 warning sign that you should be aware of.
If you'd like to see other companies earning high returns, check out our free list of companies earning high returns with solid balance sheets here.
New: AI Stock Screener & Alerts
Our new AI Stock Screener scans the market every day to uncover opportunities.
• Dividend Powerhouses (3%+ Yield)
• Undervalued Small Caps with Insider Buying
• High growth Tech and AI Companies
Or build your own from over 50 metrics.
Have feedback on this article? Concerned about the content? Get in touch with us directly. Alternatively, email editorial-team (at) simplywallst.com.
This article by Simply Wall St is general in nature. We provide commentary based on historical data and analyst forecasts only using an unbiased methodology and our articles are not intended to be financial advice. It does not constitute a recommendation to buy or sell any stock, and does not take account of your objectives, or your financial situation. We aim to bring you long-term focused analysis driven by fundamental data. Note that our analysis may not factor in the latest price-sensitive company announcements or qualitative material. Simply Wall St has no position in any stocks mentioned.
About TWSE:8454
momo.com
Engages in the TV and radio production, radio and TV program distribution, radio and TV commercial, video program distribution, issuing of magazine, and retailing businesses in Taiwan.
Excellent balance sheet with acceptable track record.
Similar Companies
Market Insights

Community Narratives

