- Taiwan
- /
- Real Estate
- /
- TWSE:2539
Why Sakura DevelopmentLtd's (TPE:2539) Shaky Earnings Are Just The Beginning Of Its Problems

The subdued market reaction suggests that Sakura Development Co.,Ltd's (TPE:2539) recent earnings didn't contain any surprises. Our analysis suggests that along with soft profit numbers, investors should be aware of some other underlying weaknesses in the numbers.
See our latest analysis for Sakura DevelopmentLtd
Zooming In On Sakura DevelopmentLtd's Earnings
As finance nerds would already know, the accrual ratio from cashflow is a key measure for assessing how well a company's free cash flow (FCF) matches its profit. The accrual ratio subtracts the FCF from the profit for a given period, and divides the result by the average operating assets of the company over that time. The ratio shows us how much a company's profit exceeds its FCF.
That means a negative accrual ratio is a good thing, because it shows that the company is bringing in more free cash flow than its profit would suggest. While it's not a problem to have a positive accrual ratio, indicating a certain level of non-cash profits, a high accrual ratio is arguably a bad thing, because it indicates paper profits are not matched by cash flow. To quote a 2014 paper by Lewellen and Resutek, "firms with higher accruals tend to be less profitable in the future".
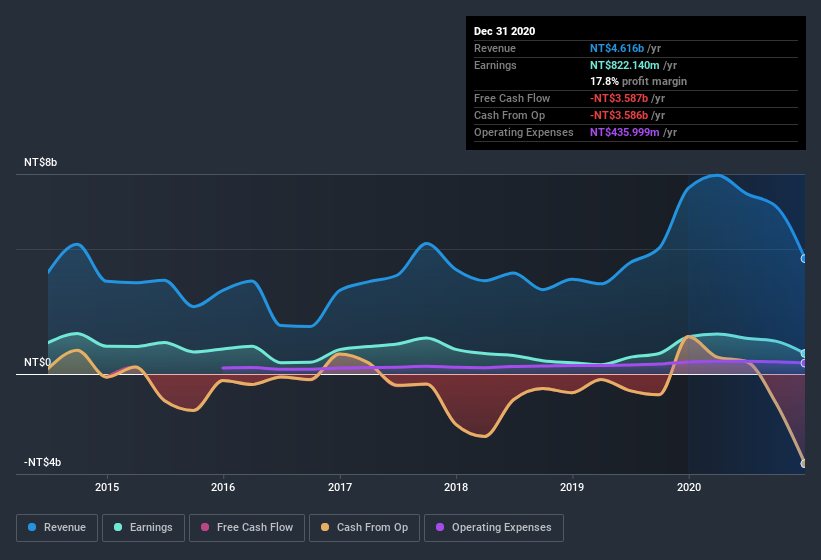
Sakura DevelopmentLtd has an accrual ratio of 0.33 for the year to December 2020. We can therefore deduce that its free cash flow fell well short of covering its statutory profit, suggesting we might want to think twice before putting a lot of weight on the latter. In the last twelve months it actually had negative free cash flow, with an outflow of NT$3.6b despite its profit of NT$822.1m, mentioned above. It's worth noting that Sakura DevelopmentLtd generated positive FCF of NT$1.5b a year ago, so at least they've done it in the past.
Note: we always recommend investors check balance sheet strength. Click here to be taken to our balance sheet analysis of Sakura DevelopmentLtd.
Our Take On Sakura DevelopmentLtd's Profit Performance
As we discussed above, we think Sakura DevelopmentLtd's earnings were not supported by free cash flow, which might concern some investors. For this reason, we think that Sakura DevelopmentLtd's statutory profits may be a bad guide to its underlying earnings power, and might give investors an overly positive impression of the company. In further bad news, its earnings per share decreased in the last year. The goal of this article has been to assess how well we can rely on the statutory earnings to reflect the company's potential, but there is plenty more to consider. So if you'd like to dive deeper into this stock, it's crucial to consider any risks it's facing. Every company has risks, and we've spotted 2 warning signs for Sakura DevelopmentLtd you should know about.
This note has only looked at a single factor that sheds light on the nature of Sakura DevelopmentLtd's profit. But there are plenty of other ways to inform your opinion of a company. For example, many people consider a high return on equity as an indication of favorable business economics, while others like to 'follow the money' and search out stocks that insiders are buying. So you may wish to see this free collection of companies boasting high return on equity, or this list of stocks that insiders are buying.
If you decide to trade Sakura DevelopmentLtd, use the lowest-cost* platform that is rated #1 Overall by Barron’s, Interactive Brokers. Trade stocks, options, futures, forex, bonds and funds on 135 markets, all from a single integrated account. Promoted
The New Payments ETF Is Live on NASDAQ:
Money is moving to real-time rails, and a newly listed ETF now gives investors direct exposure. Fast settlement. Institutional custody. Simple access.
Explore how this launch could reshape portfolios
Sponsored ContentNew: Manage All Your Stock Portfolios in One Place
We've created the ultimate portfolio companion for stock investors, and it's free.
• Connect an unlimited number of Portfolios and see your total in one currency
• Be alerted to new Warning Signs or Risks via email or mobile
• Track the Fair Value of your stocks
This article by Simply Wall St is general in nature. It does not constitute a recommendation to buy or sell any stock, and does not take account of your objectives, or your financial situation. We aim to bring you long-term focused analysis driven by fundamental data. Note that our analysis may not factor in the latest price-sensitive company announcements or qualitative material. Simply Wall St has no position in any stocks mentioned.
*Interactive Brokers Rated Lowest Cost Broker by StockBrokers.com Annual Online Review 2020
Have feedback on this article? Concerned about the content? Get in touch with us directly. Alternatively, email editorial-team (at) simplywallst.com.
About TWSE:2539
Sakura DevelopmentLtd
Engages in the sale and lease of residential properties with focus on the Zhongzhangtou area in Taiwan.
Outstanding track record with flawless balance sheet.
Similar Companies
Market Insights

Weekly Picks

Early mover in a fast growing industry. Likely to experience share price volatility as they scale


A case for CA$31.80 (undiluted), aka 8,616% upside from CA$0.37 (an 86 bagger!).


Moderation and Stabilisation: HOLD: Fair Price based on a 4-year Cycle is $12.08
Recently Updated Narratives


An amazing opportunity to potentially get a 100 bagger

Amazon: Why the World’s Biggest Platform Still Runs on Invisible Economics

Sunrun Stock: When the Energy Transition Collides With the Cost of Capital
Popular Narratives


MicroVision will explode future revenue by 380.37% with a vision towards success


Crazy Undervalued 42 Baggers Silver Play (Active & Running Mine)


NVDA: Expanding AI Demand Will Drive Major Data Center Investments Through 2026
Trending Discussion
