
Advertisement
- Taiwan
- /
- Real Estate
- /
- TWSE:9945
Investing in Ruentex DevelopmentLtd (TWSE:9945) five years ago would have delivered you a 228% gain
The most you can lose on any stock (assuming you don't use leverage) is 100% of your money. But on the bright side, you can make far more than 100% on a really good stock. One great example is Ruentex Development Co.,Ltd. (TWSE:9945) which saw its share price drive 189% higher over five years. The last week saw the share price soften some 1.7%.
So let's investigate and see if the longer term performance of the company has been in line with the underlying business' progress.
View our latest analysis for Ruentex DevelopmentLtd
While markets are a powerful pricing mechanism, share prices reflect investor sentiment, not just underlying business performance. One way to examine how market sentiment has changed over time is to look at the interaction between a company's share price and its earnings per share (EPS).
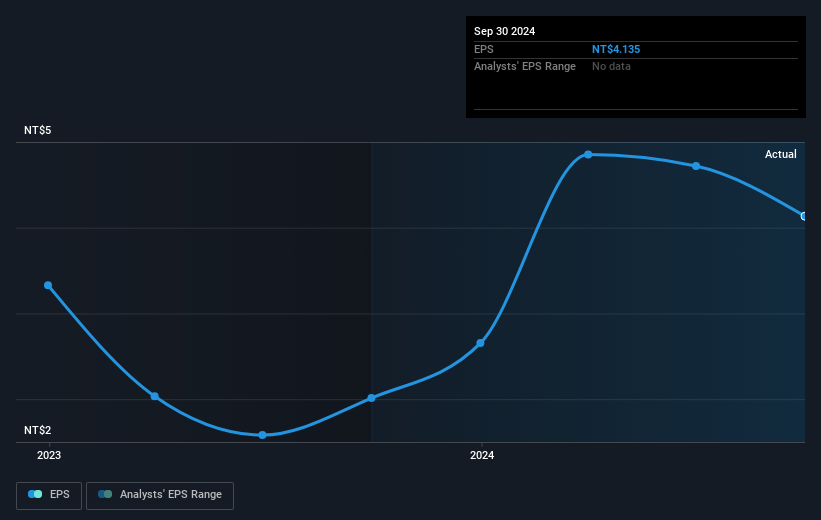
Over half a decade, Ruentex DevelopmentLtd managed to grow its earnings per share at 0.2% a year. This EPS growth is lower than the 24% average annual increase in the share price. So it's fair to assume the market has a higher opinion of the business than it did five years ago. And that's hardly shocking given the track record of growth.
The graphic below depicts how EPS has changed over time (unveil the exact values by clicking on the image).
It might be well worthwhile taking a look at our free report on Ruentex DevelopmentLtd's earnings, revenue and cash flow.
What About Dividends?
When looking at investment returns, it is important to consider the difference between total shareholder return (TSR) and share price return. Whereas the share price return only reflects the change in the share price, the TSR includes the value of dividends (assuming they were reinvested) and the benefit of any discounted capital raising or spin-off. It's fair to say that the TSR gives a more complete picture for stocks that pay a dividend. In the case of Ruentex DevelopmentLtd, it has a TSR of 228% for the last 5 years. That exceeds its share price return that we previously mentioned. And there's no prize for guessing that the dividend payments largely explain the divergence!
A Different Perspective
Ruentex DevelopmentLtd shareholders have received returns of 22% over twelve months (even including dividends), which isn't far from the general market return. We should note here that the five-year TSR is more impressive, at 27% per year. More recently, the share price growth has slowed. But it has to be said the overall picture is one of good long term and short term performance. Arguably that makes Ruentex DevelopmentLtd a stock worth watching. It's always interesting to track share price performance over the longer term. But to understand Ruentex DevelopmentLtd better, we need to consider many other factors. To that end, you should be aware of the 2 warning signs we've spotted with Ruentex DevelopmentLtd .
We will like Ruentex DevelopmentLtd better if we see some big insider buys. While we wait, check out this free list of undervalued stocks (mostly small caps) with considerable, recent, insider buying.
Please note, the market returns quoted in this article reflect the market weighted average returns of stocks that currently trade on Taiwanese exchanges.
New: AI Stock Screener & Alerts
Our new AI Stock Screener scans the market every day to uncover opportunities.
• Dividend Powerhouses (3%+ Yield)
• Undervalued Small Caps with Insider Buying
• High growth Tech and AI Companies
Or build your own from over 50 metrics.
Have feedback on this article? Concerned about the content? Get in touch with us directly. Alternatively, email editorial-team (at) simplywallst.com.
This article by Simply Wall St is general in nature. We provide commentary based on historical data and analyst forecasts only using an unbiased methodology and our articles are not intended to be financial advice. It does not constitute a recommendation to buy or sell any stock, and does not take account of your objectives, or your financial situation. We aim to bring you long-term focused analysis driven by fundamental data. Note that our analysis may not factor in the latest price-sensitive company announcements or qualitative material. Simply Wall St has no position in any stocks mentioned.
About TWSE:9945
Ruentex DevelopmentLtd
Engages in construction business in Taiwan and internationally.
Low risk and slightly overvalued.
Similar Companies
Market Insights

Advertisement
Community Narratives
MINISO's fair value is projected at 26.69 with an anticipated PE ratio shift of 20x
Fair Value US$24.03|9.0% undervalued
BE
Community Contributor
Procter & Gamble: A Dividend Giant Facing Slowing Growth
Fair Value US$119.81|23.5% overvalued
AN
Community Contributor
Eli Lilly's Future Growth Driven by Tirzepatide and Favorable Market Conditions
Fair Value US$1.19k|14.4% undervalued
EA
Community Contributor