SYN-TECH Chem. & Pharm's (GTSM:1777) Shareholders Are Down 11% On Their Shares


Ideally, your overall portfolio should beat the market average. But every investor is virtually certain to have both over-performing and under-performing stocks. At this point some shareholders may be questioning their investment in SYN-TECH Chem. & Pharm. Co., Ltd. (GTSM:1777), since the last five years saw the share price fall 11%. Unhappily, the share price slid 2.4% in the last week.
Check out our latest analysis for SYN-TECH Chem. & Pharm
To quote Buffett, 'Ships will sail around the world but the Flat Earth Society will flourish. There will continue to be wide discrepancies between price and value in the marketplace...' One imperfect but simple way to consider how the market perception of a company has shifted is to compare the change in the earnings per share (EPS) with the share price movement.
During the unfortunate half decade during which the share price slipped, SYN-TECH Chem. & Pharm actually saw its earnings per share (EPS) improve by 3.3% per year. So it doesn't seem like EPS is a great guide to understanding how the market is valuing the stock. Or possibly, the market was previously very optimistic, so the stock has disappointed, despite improving EPS.
Given that EPS has increased, but the share price has fallen, it's fair to say that market sentiment around the stock has become more negative. That said, if EPS continues to increase, it seems very likely the share price will get a boost, in the long term.
The graphic below depicts how EPS has changed over time (unveil the exact values by clicking on the image).
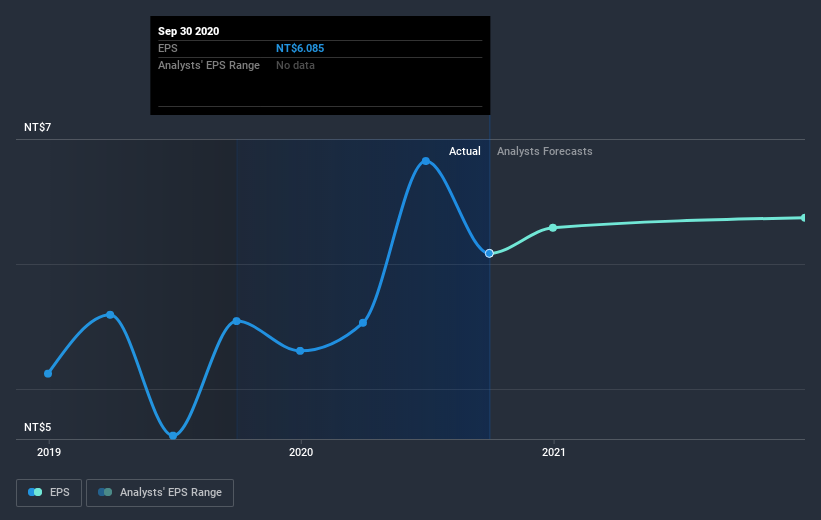
Before buying or selling a stock, we always recommend a close examination of historic growth trends, available here.
What About Dividends?
It is important to consider the total shareholder return, as well as the share price return, for any given stock. The TSR is a return calculation that accounts for the value of cash dividends (assuming that any dividend received was reinvested) and the calculated value of any discounted capital raisings and spin-offs. So for companies that pay a generous dividend, the TSR is often a lot higher than the share price return. As it happens, SYN-TECH Chem. & Pharm's TSR for the last 5 years was 7.3%, which exceeds the share price return mentioned earlier. The dividends paid by the company have thusly boosted the total shareholder return.
A Different Perspective
SYN-TECH Chem. & Pharm shareholders are down 5.1% for the year (even including dividends), but the market itself is up 33%. However, keep in mind that even the best stocks will sometimes underperform the market over a twelve month period. Longer term investors wouldn't be so upset, since they would have made 1.4%, each year, over five years. If the fundamental data continues to indicate long term sustainable growth, the current sell-off could be an opportunity worth considering. While it is well worth considering the different impacts that market conditions can have on the share price, there are other factors that are even more important. For example, we've discovered 2 warning signs for SYN-TECH Chem. & Pharm that you should be aware of before investing here.
If you like to buy stocks alongside management, then you might just love this free list of companies. (Hint: insiders have been buying them).
Please note, the market returns quoted in this article reflect the market weighted average returns of stocks that currently trade on TW exchanges.
If you decide to trade SYN-TECH Chem. & Pharm, use the lowest-cost* platform that is rated #1 Overall by Barron’s, Interactive Brokers. Trade stocks, options, futures, forex, bonds and funds on 135 markets, all from a single integrated account. Promoted
New: Manage All Your Stock Portfolios in One Place
We've created the ultimate portfolio companion for stock investors, and it's free.
• Connect an unlimited number of Portfolios and see your total in one currency
• Be alerted to new Warning Signs or Risks via email or mobile
• Track the Fair Value of your stocks
This article by Simply Wall St is general in nature. It does not constitute a recommendation to buy or sell any stock, and does not take account of your objectives, or your financial situation. We aim to bring you long-term focused analysis driven by fundamental data. Note that our analysis may not factor in the latest price-sensitive company announcements or qualitative material. Simply Wall St has no position in any stocks mentioned.
*Interactive Brokers Rated Lowest Cost Broker by StockBrokers.com Annual Online Review 2020
Have feedback on this article? Concerned about the content? Get in touch with us directly. Alternatively, email editorial-team (at) simplywallst.com.
About TPEX:1777
SYN-TECH Chem. & Pharm
Manufactures and sells active pharmaceutical ingredients (APIs) in Taiwan, Asia, Europe, the Americas, and internationally.
Flawless balance sheet with proven track record and pays a dividend.
Market Insights

Community Narratives

