
Advertisement

If we're looking to avoid a business that is in decline, what are the trends that can warn us ahead of time? Businesses in decline often have two underlying trends, firstly, a declining return on capital employed (ROCE) and a declining base of capital employed. This indicates to us that the business is not only shrinking the size of its net assets, but its returns are falling as well. And from a first read, things don't look too good at Hwang Chang General Contractor (TPE:2543), so let's see why.
Return On Capital Employed (ROCE): What is it?
If you haven't worked with ROCE before, it measures the 'return' (pre-tax profit) a company generates from capital employed in its business. The formula for this calculation on Hwang Chang General Contractor is:
Return on Capital Employed = Earnings Before Interest and Tax (EBIT) ÷ (Total Assets - Current Liabilities)
0.03 = NT$86m ÷ (NT$7.9b - NT$5.0b) (Based on the trailing twelve months to September 2020).
Thus, Hwang Chang General Contractor has an ROCE of 3.0%. Ultimately, that's a low return and it under-performs the Construction industry average of 7.5%.
See our latest analysis for Hwang Chang General Contractor
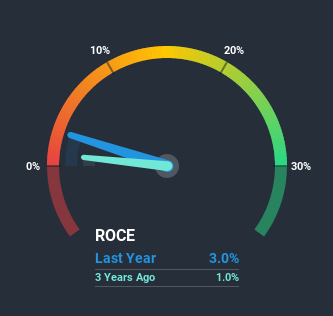
Historical performance is a great place to start when researching a stock so above you can see the gauge for Hwang Chang General Contractor's ROCE against it's prior returns. If you're interested in investigating Hwang Chang General Contractor's past further, check out this free graph of past earnings, revenue and cash flow.
What Does the ROCE Trend For Hwang Chang General Contractor Tell Us?
There is reason to be cautious about Hwang Chang General Contractor, given the returns are trending downwards. To be more specific, the ROCE was 9.2% five years ago, but since then it has dropped noticeably. And on the capital employed front, the business is utilizing roughly the same amount of capital as it was back then. This combination can be indicative of a mature business that still has areas to deploy capital, but the returns received aren't as high due potentially to new competition or smaller margins. So because these trends aren't typically conducive to creating a multi-bagger, we wouldn't hold our breath on Hwang Chang General Contractor becoming one if things continue as they have.
While on the subject, we noticed that the ratio of current liabilities to total assets has risen to 63%, which has impacted the ROCE. Without this increase, it's likely that ROCE would be even lower than 3.0%. And with current liabilities at these levels, suppliers or short-term creditors are effectively funding a large part of the business, which can introduce some risks.
The Bottom Line On Hwang Chang General Contractor's ROCE
All in all, the lower returns from the same amount of capital employed aren't exactly signs of a compounding machine. Investors haven't taken kindly to these developments, since the stock has declined 11% from where it was five years ago. With underlying trends that aren't great in these areas, we'd consider looking elsewhere.
Since virtually every company faces some risks, it's worth knowing what they are, and we've spotted 4 warning signs for Hwang Chang General Contractor (of which 3 make us uncomfortable!) that you should know about.
While Hwang Chang General Contractor may not currently earn the highest returns, we've compiled a list of companies that currently earn more than 25% return on equity. Check out this free list here.
If you’re looking to trade Hwang Chang General Contractor, open an account with the lowest-cost* platform trusted by professionals, Interactive Brokers. Their clients from over 200 countries and territories trade stocks, options, futures, forex, bonds and funds worldwide from a single integrated account. Promoted
Valuation is complex, but we're here to simplify it.
Discover if Hwang Chang General Contractor might be undervalued or overvalued with our detailed analysis, featuring fair value estimates, potential risks, dividends, insider trades, and its financial condition.
Access Free AnalysisThis article by Simply Wall St is general in nature. It does not constitute a recommendation to buy or sell any stock, and does not take account of your objectives, or your financial situation. We aim to bring you long-term focused analysis driven by fundamental data. Note that our analysis may not factor in the latest price-sensitive company announcements or qualitative material. Simply Wall St has no position in any stocks mentioned.
*Interactive Brokers Rated Lowest Cost Broker by StockBrokers.com Annual Online Review 2020
Have feedback on this article? Concerned about the content? Get in touch with us directly. Alternatively, email editorial-team (at) simplywallst.com.
About TWSE:2543
Hwang Chang General Contractor
Engages in the contracting business of civil engineering projects in Taiwan.
Solid track record with excellent balance sheet.
Market Insights


Advertisement
Community Narratives
Nike's Direct-to-Consumer Focus Will Drive Future Growth
Fair Value US$87.90|18.2% undervalued
UN
Community Contributor
Novo Nordisk will dominate GLP-1 market with Ozempic and Wegovy growth
Fair Value US$89.59|12.1% undervalued
BE
Community Contributor
Rheinmetall could get 20-25% of EU-NATO 3%-GDP defence spending
Fair Value €7.57k|82.8% undervalued
NO
Community Contributor