Would Shareholders Who Purchased Cheng Fwa Industrial's (GTSM:5426) Stock Three Years Be Happy With The Share price Today?


In order to justify the effort of selecting individual stocks, it's worth striving to beat the returns from a market index fund. But if you try your hand at stock picking, your risk returning less than the market. Unfortunately, that's been the case for longer term Cheng Fwa Industrial Co., Ltd. (GTSM:5426) shareholders, since the share price is down 41% in the last three years, falling well short of the market return of around 55%.
View our latest analysis for Cheng Fwa Industrial
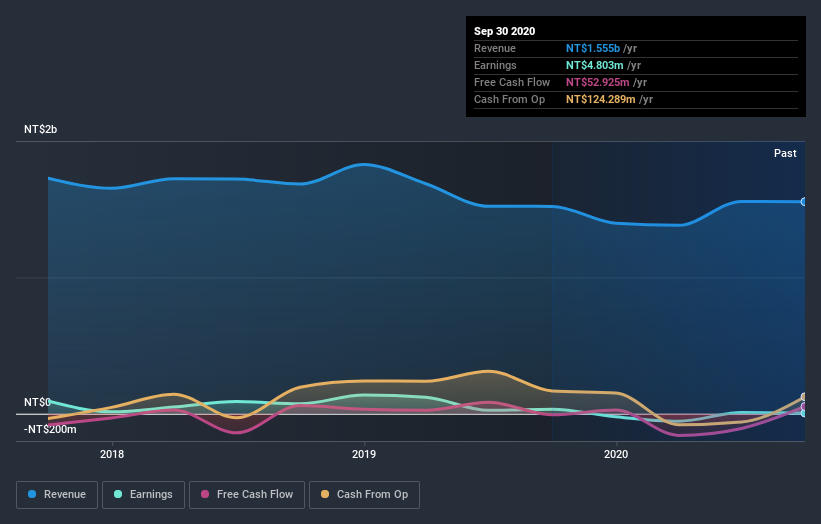
Given that Cheng Fwa Industrial only made minimal earnings in the last twelve months, we'll focus on revenue to gauge its business development. As a general rule, we think this kind of company is more comparable to loss-making stocks, since the actual profit is so low. It would be hard to believe in a more profitable future without growing revenues.
In the last three years Cheng Fwa Industrial saw its revenue shrink by 6.1% per year. That is not a good result. The stock has disappointed holders over the last three years, falling 12%, annualized. That makes sense given the lack of either profits or revenue growth. However, in this kind of situation you can sometimes find opportunity, where sentiment is negative but the company is actually making good progress.
You can see below how earnings and revenue have changed over time (discover the exact values by clicking on the image).
Take a more thorough look at Cheng Fwa Industrial's financial health with this free report on its balance sheet.
What About Dividends?
When looking at investment returns, it is important to consider the difference between total shareholder return (TSR) and share price return. Whereas the share price return only reflects the change in the share price, the TSR includes the value of dividends (assuming they were reinvested) and the benefit of any discounted capital raising or spin-off. It's fair to say that the TSR gives a more complete picture for stocks that pay a dividend. As it happens, Cheng Fwa Industrial's TSR for the last 3 years was -37%, which exceeds the share price return mentioned earlier. The dividends paid by the company have thusly boosted the total shareholder return.
A Different Perspective
While the broader market gained around 33% in the last year, Cheng Fwa Industrial shareholders lost 10% (even including dividends). Even the share prices of good stocks drop sometimes, but we want to see improvements in the fundamental metrics of a business, before getting too interested. Longer term investors wouldn't be so upset, since they would have made 4%, each year, over five years. If the fundamental data continues to indicate long term sustainable growth, the current sell-off could be an opportunity worth considering. While it is well worth considering the different impacts that market conditions can have on the share price, there are other factors that are even more important. Take risks, for example - Cheng Fwa Industrial has 5 warning signs (and 1 which shouldn't be ignored) we think you should know about.
If you like to buy stocks alongside management, then you might just love this free list of companies. (Hint: insiders have been buying them).
Please note, the market returns quoted in this article reflect the market weighted average returns of stocks that currently trade on TW exchanges.
If you decide to trade Cheng Fwa Industrial, use the lowest-cost* platform that is rated #1 Overall by Barron’s, Interactive Brokers. Trade stocks, options, futures, forex, bonds and funds on 135 markets, all from a single integrated account. Promoted
If you're looking to trade Cheng Fwa Industrial, open an account with the lowest-cost platform trusted by professionals, Interactive Brokers.
With clients in over 200 countries and territories, and access to 160 markets, IBKR lets you trade stocks, options, futures, forex, bonds and funds from a single integrated account.
Enjoy no hidden fees, no account minimums, and FX conversion rates as low as 0.03%, far better than what most brokers offer.
Sponsored ContentNew: AI Stock Screener & Alerts
Our new AI Stock Screener scans the market every day to uncover opportunities.
• Dividend Powerhouses (3%+ Yield)
• Undervalued Small Caps with Insider Buying
• High growth Tech and AI Companies
Or build your own from over 50 metrics.
This article by Simply Wall St is general in nature. It does not constitute a recommendation to buy or sell any stock, and does not take account of your objectives, or your financial situation. We aim to bring you long-term focused analysis driven by fundamental data. Note that our analysis may not factor in the latest price-sensitive company announcements or qualitative material. Simply Wall St has no position in any stocks mentioned.
*Interactive Brokers Rated Lowest Cost Broker by StockBrokers.com Annual Online Review 2020
Have feedback on this article? Concerned about the content? Get in touch with us directly. Alternatively, email editorial-team (at) simplywallst.com.
About TPEX:5426
Cheng Fwa Industrial
Manufactures and supplies precision stamping metal parts for computer, telecommunication, networking, and electronic industries in Taiwan.
Flawless balance sheet with proven track record.
Market Insights

Community Narratives

